This page explains how to send traces from Java applications to Mackerel.
Overview
Mackerel collects traces using the OpenTelemetry mechanism (instrumentation). While there are various ways to collect OpenTelemetry-compatible traces, this page explains zero-code instrumentation, a method that allows you to send traces without modifying your application's implementation.
📝 Note
Java zero-code instrumentation is achieved by running the application with an agent that automatically inserts code to collect telemetry data. For more details, see Java Agent.
Requirements
Zero-code instrumentation for Java uses the OpenTelemetry Java Agent (hereafter referred to as Java Agent).
Java Agent Requirements
- Java 8 or later
📝 Note
For detailed compatibility requirements, see OpenTelemetry Java Instrumentation Versioning.
Supported Libraries
For libraries supported by the Java Agent, please refer to the following page:
Installation
To send traces from your application to Mackerel, do the following:
- Download the Java Agent
- Run your application using the Java Agent
1. Download the Java Agent
Use the following command to download the latest version of the Java Agent (opentelemetry-javaagent.jar) and place it in a location accessible by your application:
curl -L -O https://github.com/open-telemetry/opentelemetry-java-instrumentation/releases/latest/download/opentelemetry-javaagent.jar
You can also download it from the opentelemetry-java-instrumentation releases page.
2. Run your application using the Java Agent
Specify the Java Agent (opentelemetry-javaagent.jar) with -javaagent in the startup options, add other settings, and start the application.
By setting your Mackerel API key with write permissions in the MACKEREL_APIKEY environment variable and executing the command below, traces will be sent to Mackerel under the service name my-sample-app:
java -javaagent:opentelemetry-javaagent.jar \
  -Dotel.traces.exporter=otlp \
  -Dotel.service.name=my-sample-app \
  -Dotel.exporter.otlp.protocol=http/protobuf \
  -Dotel.exporter.otlp.traces.endpoint=https://otlp-vaxila.mackerelio.com/v1/traces \
  -Dotel.exporter.otlp.traces.headers="Accept=*/*,Mackerel-Api-Key=${MACKEREL_APIKEY}" \
  -Dotel.metrics.exporter=none \
  -Dotel.logs.exporter=none \
  -jar build/libs/demo-0.0.1-SNAPSHOT.jar # Replace this line with your application.
- Setting
-Dotel.traces.exportertoconsolewill output traces to standard output. Multiple values can be specified separated by commas. -Dotel.service.nameis the service name of the trace (the value of theservice.nameattribute).-Dotel.exporter.otlp.traces.endpointspecifies the destination for sending traces.- To send directly to Mackerel, specify
https://otlp-vaxila.mackerelio.com/v1/traces. - To send via a Collector, specify
http://<Collector address:port>/v1/traces.
- To send directly to Mackerel, specify
${MACKEREL_APIKEY}specifies the Mackerel API key. Define an API key with Write permission from the API key list as an environment variable in the system where the application runs.- It will work if you write the API key directly instead of using an environment variable.
- Disable metrics and logs that are not related to trace transmission.
-Dotel.metrics.exporter=none-Dotel.logs.exporter=none
Viewing sent traces
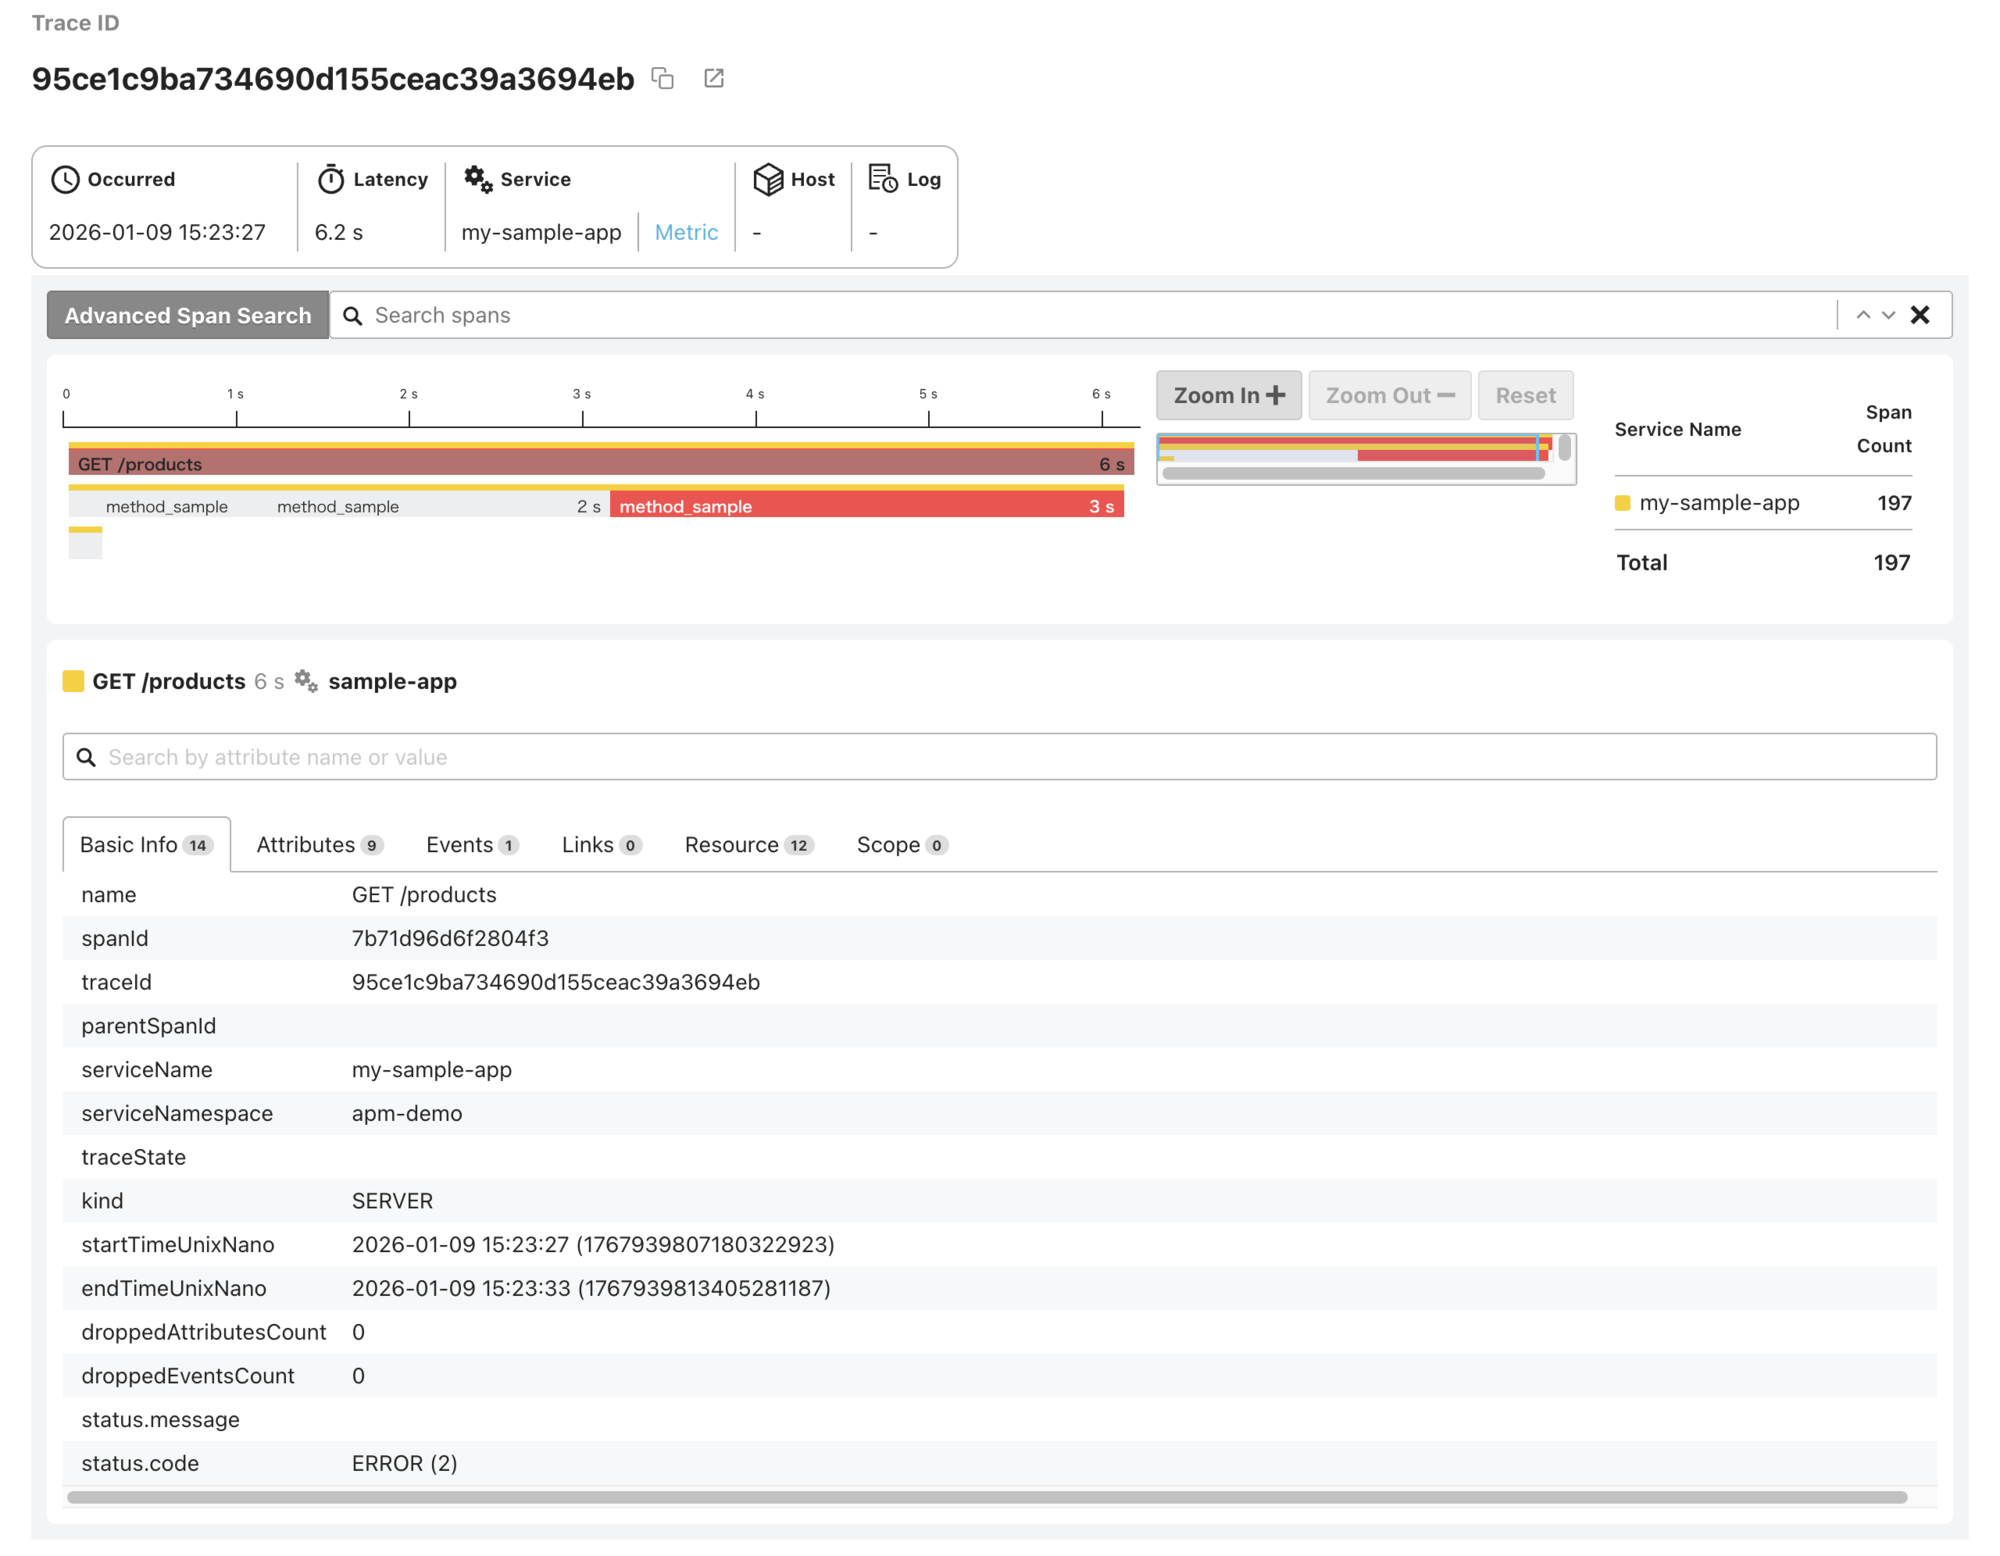
Sent traces can be verified by following these steps:
- Select "APM" from the menu
- Select the service name
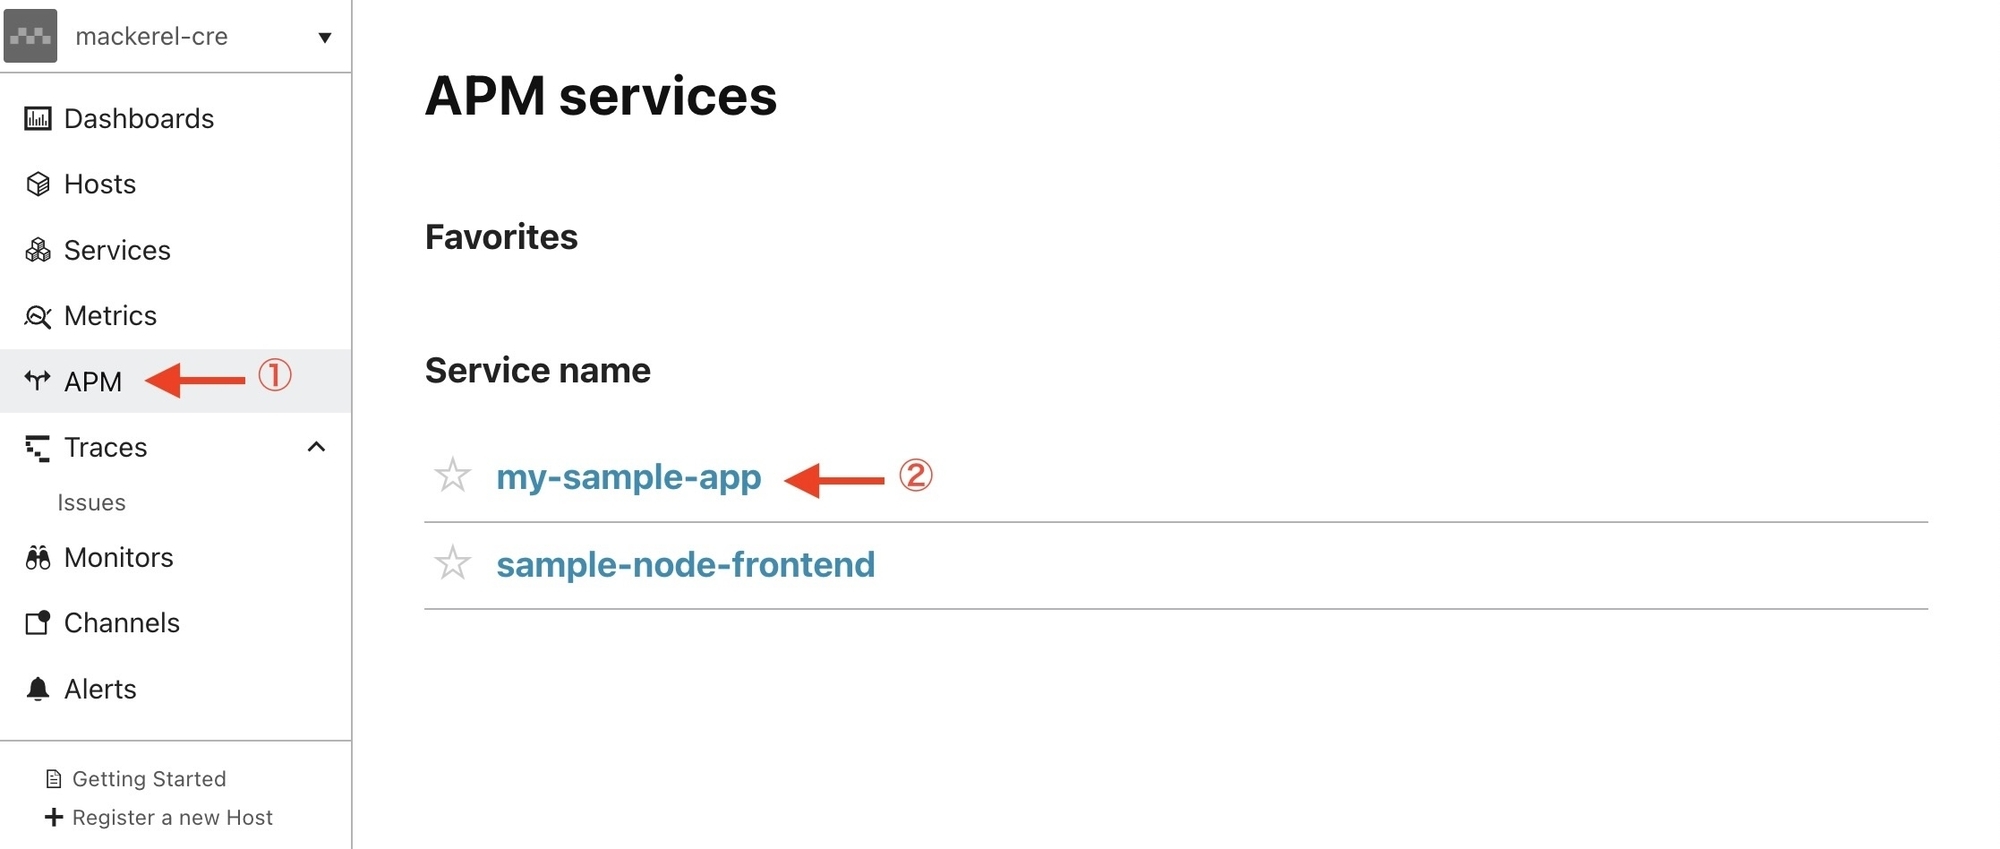
- Select the "Traces" tab
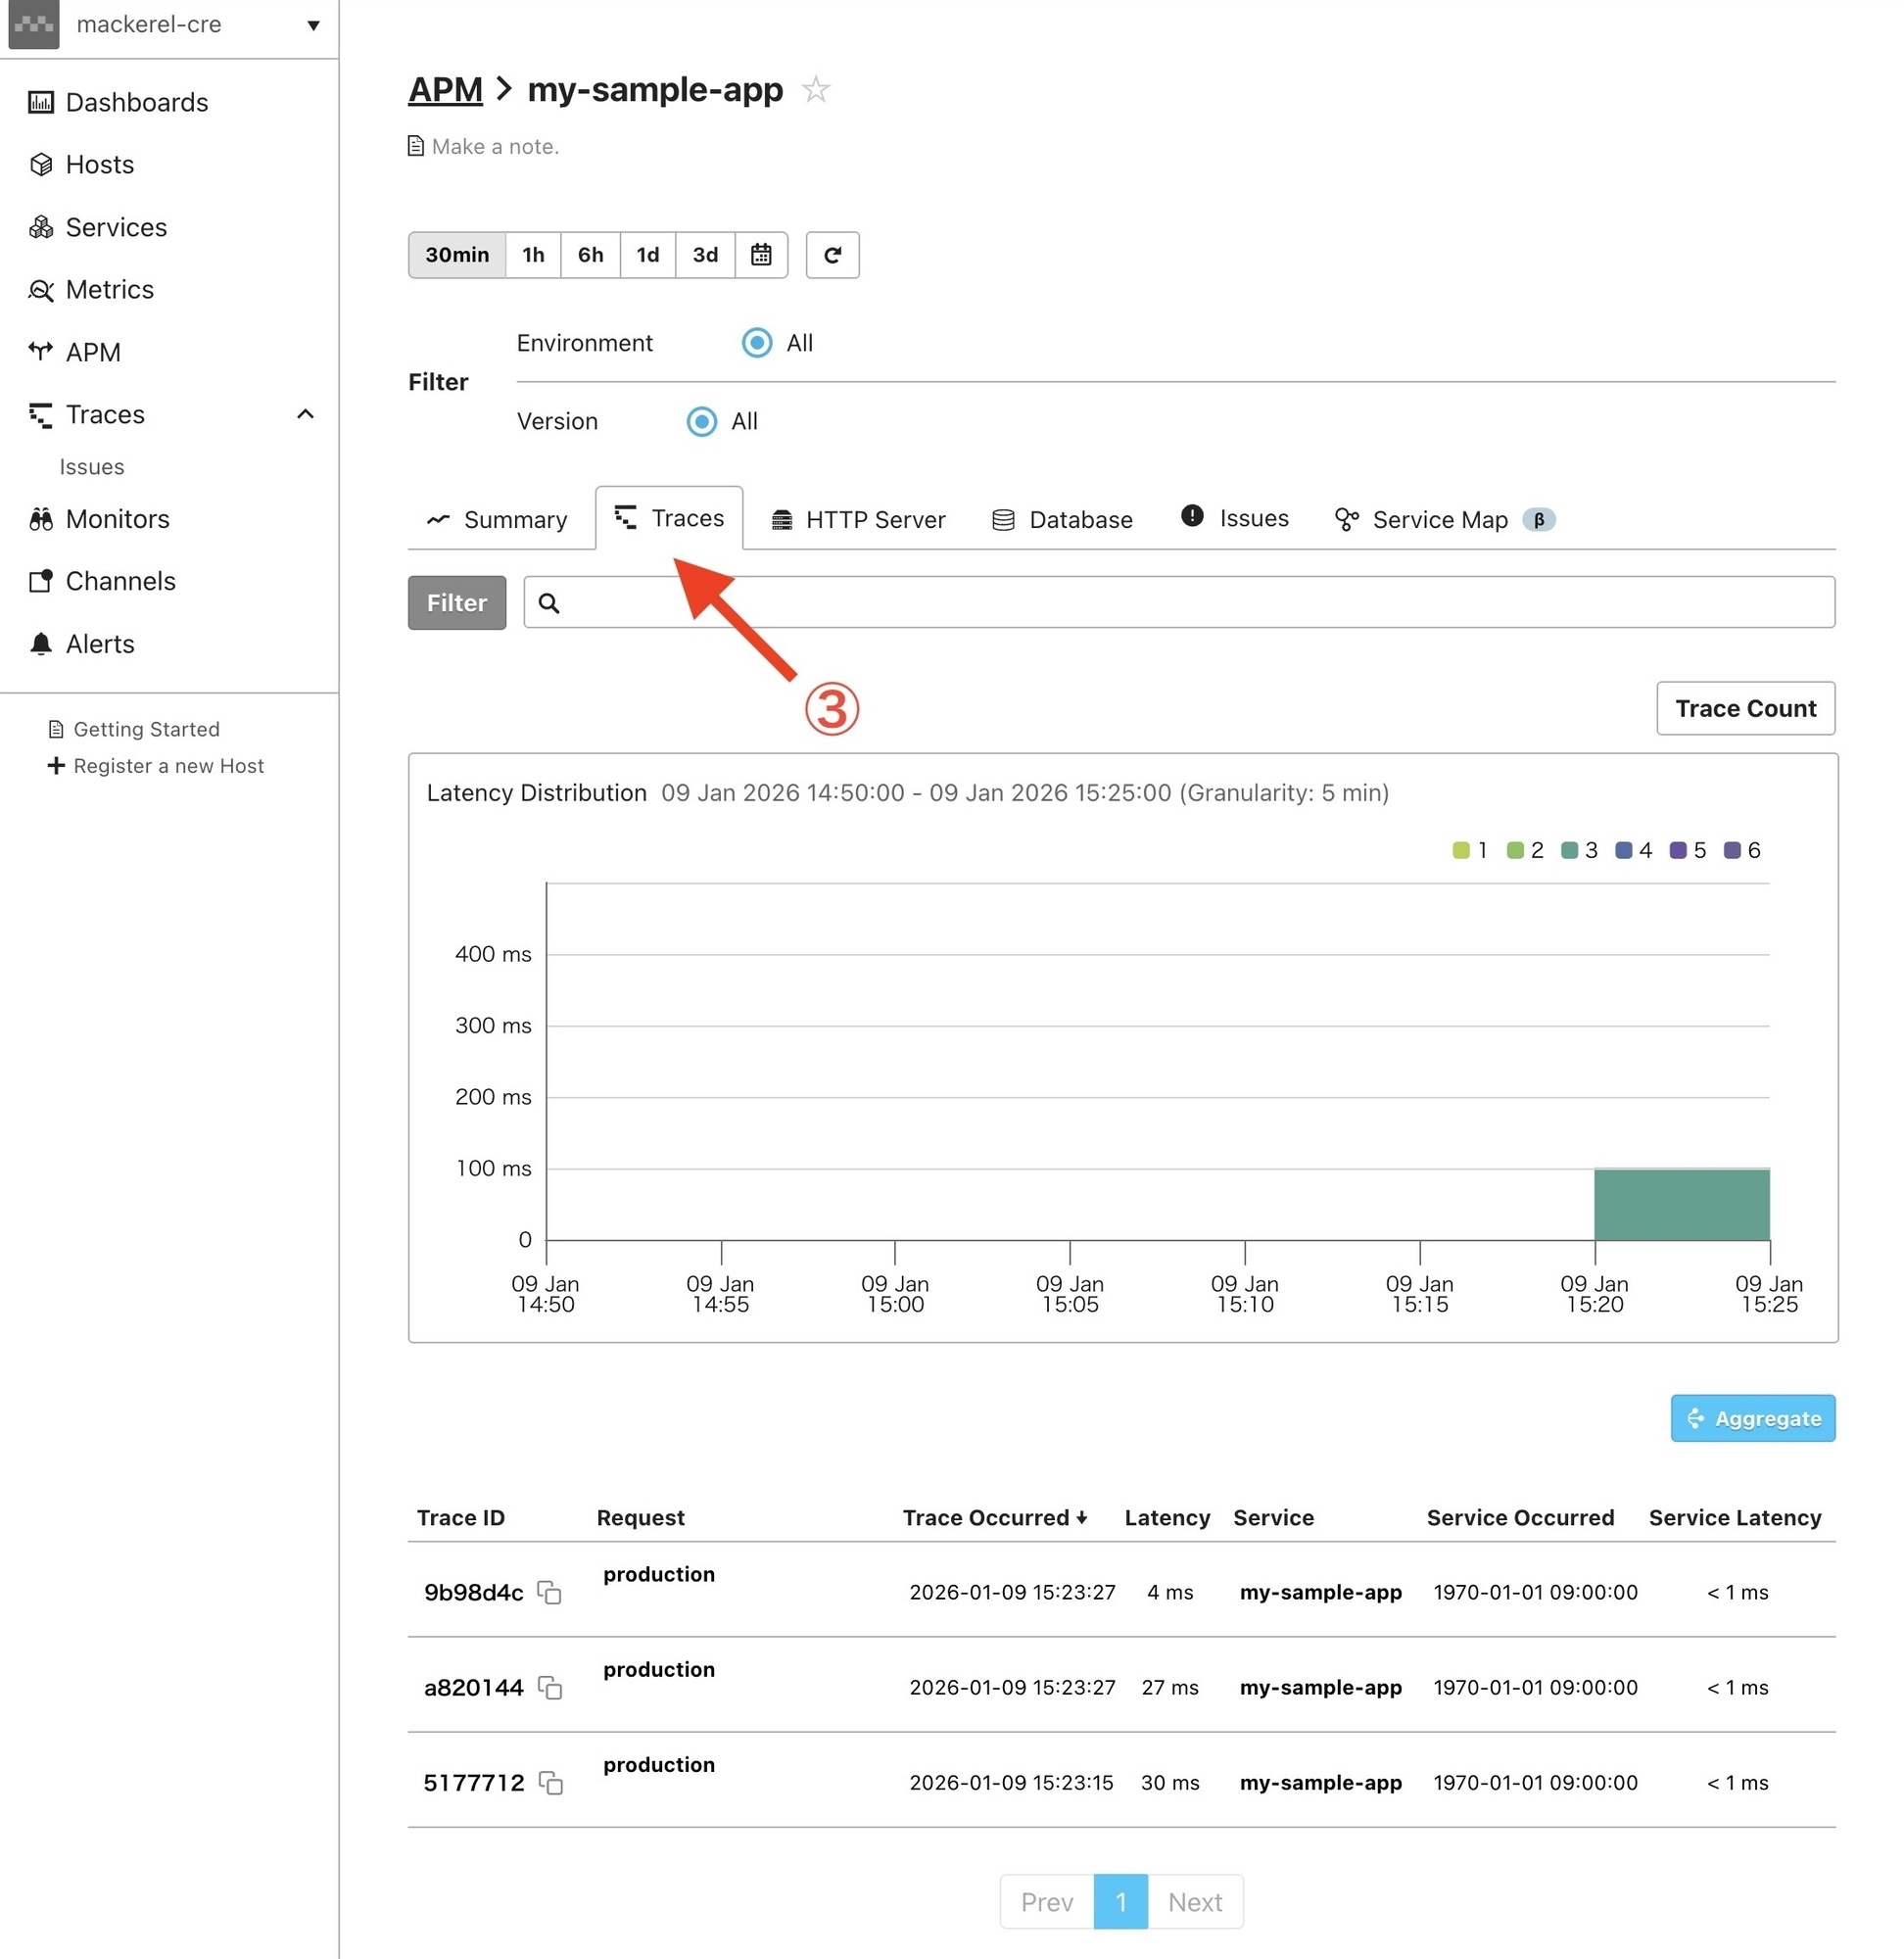
- Select a trace from the trace list to view its details
That's a wrap on setting up zero-code instrumentation and sending traces of your Java applications to Mackerel.