With Mackerel, you can monitor logs such as the following using official check plugins.
- Log files
- Windows Event Log
- Amazon CloudWatch Logs
This page guides you through installing check plugins and setting up simple monitoring configurations based on log types. For detailed settings, please refer to the help documentation for the specific plugins you use.
Getting Started with Log Monitoring
1. Install the Official Check Plugin Pack
Refer to Using the official check plugin pack for check monitoring to install the official check plugin pack.
2. Add Check Monitoring Configuration
Add the check monitoring configuration for the logs you want to monitor to the end of the mackerel-agent.conf file on the target server.
The format for the settings to be added is as follows:
[plugin.checks.<monitoring_rule_name>]
command = ["command_to_execute", "argument", "argument", ...]
After appending the configuration, restart the mackerel-agent (or use reload on Linux) to start monitoring.
The specified monitor name will appear under Monitors for the target host if the configuration is successfully applied.

After configuration, verify functionality by appending an error string to the monitored log to confirm alerts are triggered.
Below are configuration examples for different logs you may want to monitor.
Monitoring Log File (check-log)
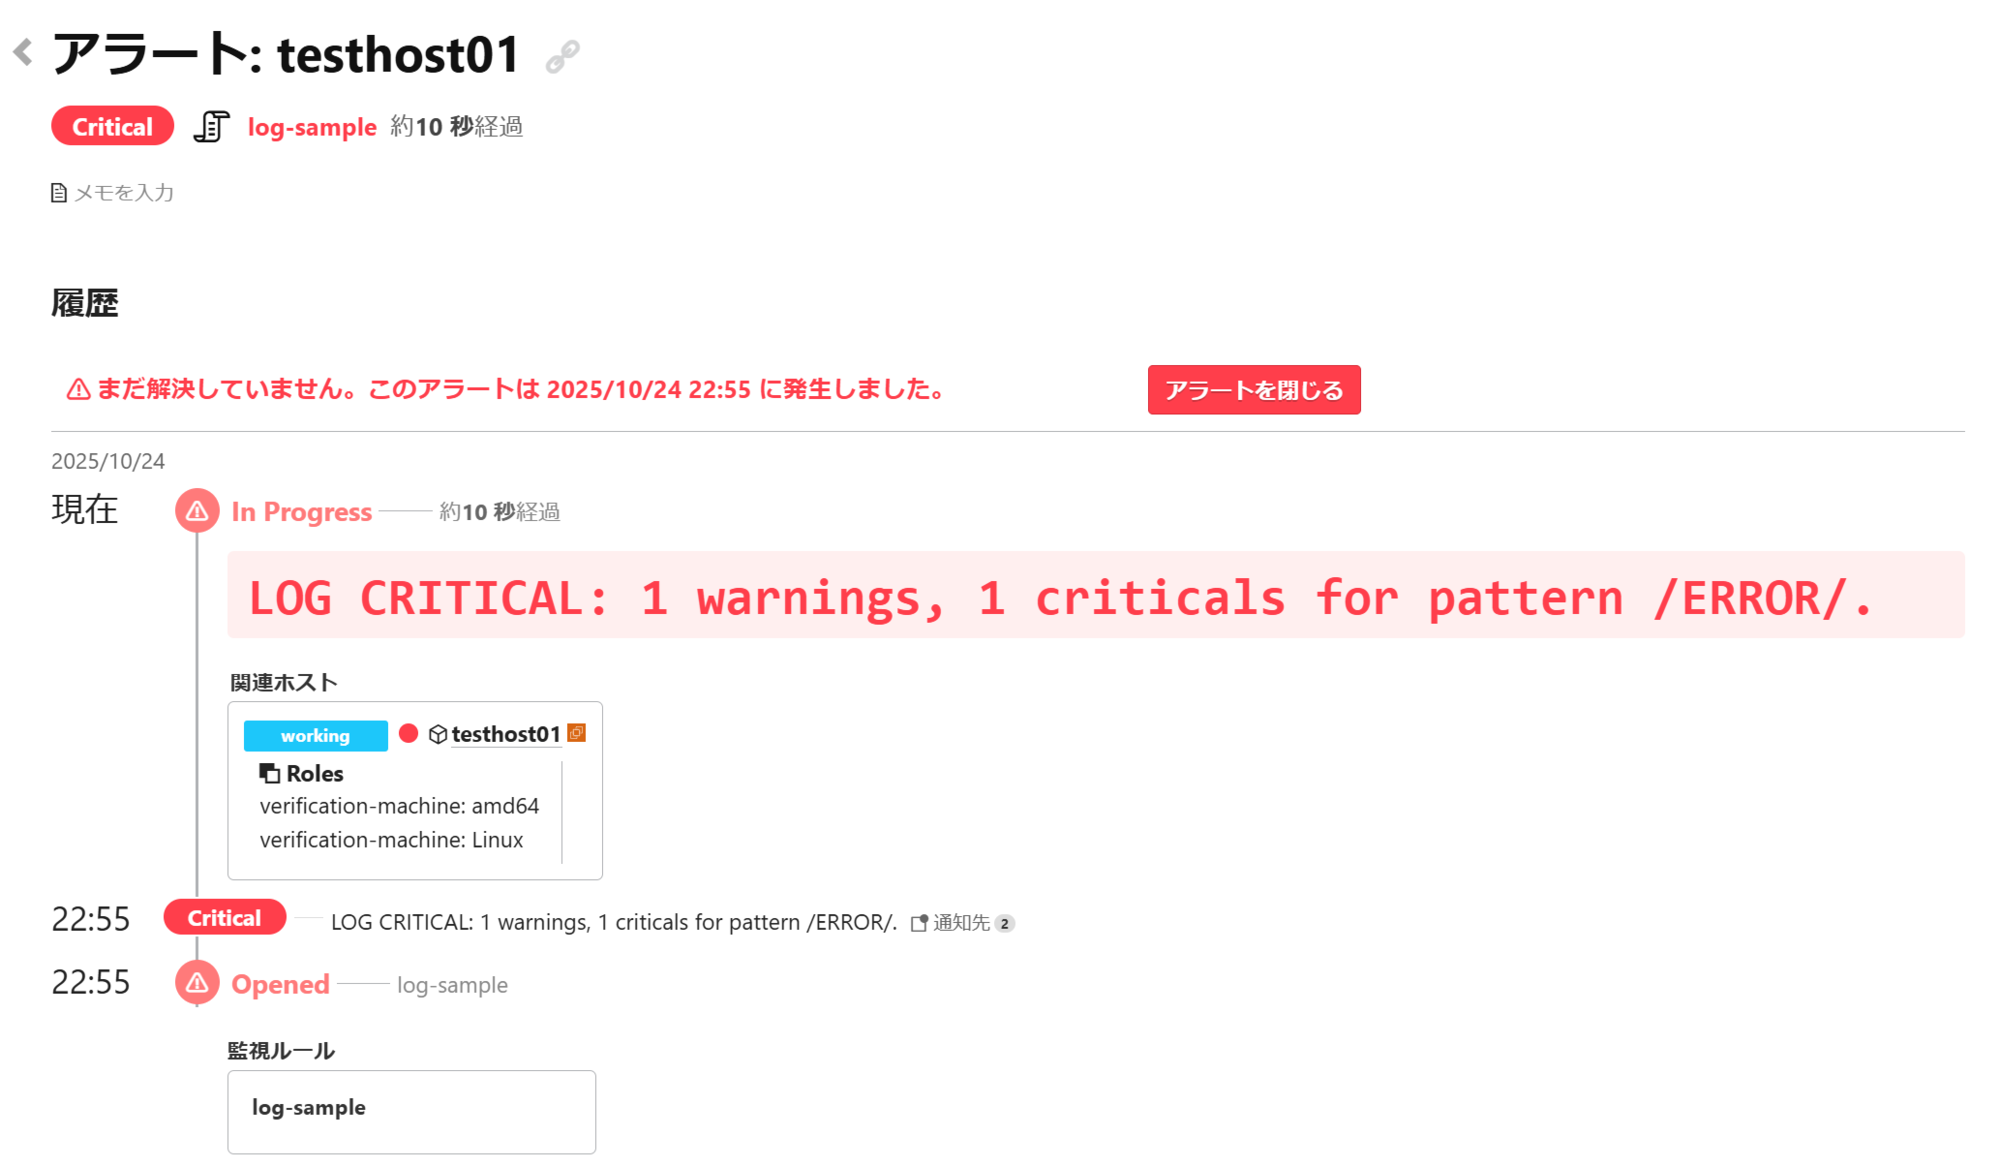
The following example uses the monitor name log-sample to trigger a CRITICAL alert when ERROR is output to /var/log/messages.
[plugin.checks.log-sample]
command = ["check-log", "--file", "/var/log/messages", "--pattern", "ERROR"]
Additionally, depending on your monitoring objectives, you can configure settings such as using the number of logs matching a pattern as an alert condition or monitoring multiple files. For details, please refer to Check plugins - check-log - Mackerel Docs.
Monitoring Windows Event Log (check-windows-eventlog)
Windows Event Log can be monitored using the check-windows-eventlog plugin.
Below is an example using the monitor name windows-eventlog-sample. It triggers an alert if an event in the Application log has an event level of Error and the event message contains the string ERROR.
[plugin.checks.windows-eventlog-sample]
command = ["check-windows-eventlog", "--log", "Application", "--type", "Error", "--message-pattern", "ERROR"]
When an alert is triggered with the above configuration, a log like Event Log CRITICAL: 0 warnings, 1 criticals. will appear in the Mackerel alert details screen.
Additionally, you can monitor the System log or target specific event IDs and event sources. For details, refer to the Check plugins - check-windows-eventlog - Mackerel Docs.
Monitoring Amazon CloudWatch Logs (check-aws-cloudwatch-log)
Amazon CloudWatch Logs can be monitored using the check-aws-cloudwatch-logs plugin. Use Amazon CloudWatch Logs filter patterns to define the string conditions you want to detect.
Below is an example with the monitor name aws-cloudwatch-logs-sample. It triggers a CRITICAL alert if a string containing Error is output to the log group /aws/lambda/sample_log_group.
[plugin.checks.aws-cloudwatch-logs-sample]
command = ["check-aws-cloudwatch-logs", "--log-group-name", "/aws/lambda/sample_log_group", "--pattern", "Error"]
When an alert is triggered with the above configuration, a log like CloudWatch Logs CRITICAL: 1 > 0 messages for pattern /Error/ will appear on the alert details screen.
Additionally, you can narrow down the target log stream using a prefix or set the number of logs matching the pattern as an alert condition. For details, please refer to Check plugins - check-aws-cloudwatch-logs - Mackerel Docs.
Besides, by installing the separate check-aws-cloudwatch-logs-insights plugin, you can enable monitoring using CloudWatch Logs Insights syntax.
For differences from the check-aws-cloudwatch-logs plugin and installation instructions, see Check plugins - check-aws-cloudwatch-logs-insights - Mackerel Docs.
3. Modifying Check Monitoring Behavior
You can configure settings such as the check monitoring execution interval and the number of consecutive abnormal detections required to trigger an alert, as needed. The following example changes the default 1-minute execution interval to 10 minutes and triggers an alert only if all results from three consecutive executions are abnormal.
[plugin.checks.messages_error]
command = ["check-log", "--file", "/var/log/messages", "--pattern", "ERROR"]
check_interval = 10m
max_check_attempts = 3
For other configurable items for check monitoring, refer to Adding monitors for script checks - Mackerel Docs.
Monitoring Using Experimental Plugins
While not included in the official check plugin pack, Mackerel offers experimental plugins for other log monitoring purposes via Mackerel Labs.
The cloudwatch-logs-aggregator plugin aggregates logs from Amazon CloudWatch Logs and posts them as metrics.
- Aggregate Amazon CloudWatch Logs and Post Metrics to Mackerel - Mackerel Help
- Practical Implementation of Metricization for Amazon CloudWatch Logs Using cloudwatch-logs-aggregator
mackerel-sql-metric-collector allows you to post query results from various databases, including MySQL and Athena, as metrics.
- mackerel-sql-metric-collector - README (in Japanese)
- Introducing "mackerel-sql-metric-collector": A tool to freely post query results from various databases to Mackerel (in Japanese)
check-systemd-journal enables monitoring of journald logs.
Software released by Mackerel Labs is experimental and therefore not covered by our official support. Please understand that we generally cannot respond to inquiries regarding these tools.