Check monitoring is a feature to monitor the execution results of a check plugin. The agent will execute the check plugin periodically and send the results to Mackerel. Each check monitor item counts as one host metric. Please refer to Differences between metric monitoring and check monitoring for more information on the differences between check monitoring and the monitoring of host metrics and service metrics.
- About check plugins
- Sample agent configuration
- Check plugin specs
- Check monitoring notifications
- Differences between metric monitoring and check monitoring
- Sample check plugin
- How to confirm
About check plugins
A program that performs the desired monitoring process is required for check monitoring. We have released an official check plugin pack that can be used for this purpose. Please refer to Using the official check plugin pack for check monitoring for more information.
In addition to the official check plugins, you can create custom check plugins following the check plugin specification. The Sample check plugin section below provides sample check plugins written in shell script, PowerShell, and Windows batch file.
Sample agent configuration
Check monitoring settings are added to the Agent configuration file. The following is a sample monitor configuration using the shell script from the Examples section. Please refer to Configuration items for a description of each item. Please set the non-required fields as needed.
[plugin.checks.filecount]
command = ["/path/filecount.sh"]
user = "SOME_USER_NAME"
check_interval = 5
timeout_seconds = 45
max_check_attempts = 3
prevent_alert_auto_close = true
notification_interval = 60
custom_identifier = "SOME_IDENTIFIER"
env = { HOST = "hostname", PORT = "port" }
memo = "This check monitor is ..."
Configuration items
As shown in the sample configuration for the agent, it should be followed by the key [plugin.checks.XXX] of the monitoring rule. Each configuration item must be configured for each monitoring rule.
| Configuration item | Required | Description | Default value |
|---|---|---|---|
| [plugin.checks.XXX] | ✓ | Define the key values of the monitoring rules in the configuration file in three levels separated by dots . The second level, plugin.checks., is fixed, and the third level, XXX, is used as the name of the monitoring rule. Dots are not allowed in XXX. The third level, XXX, will be used as the monitoring rule name. |
|
| command | ✓ | This is executed by the agent periodically, and its exit status and standard output are used as the monitoring results. Users may also execute arbitrary commands and programs they have created, in addition to the official check plugin. | |
| user | The user to run command can be specified with command. If a user is not specified, the executing user of mackerel-agent will also be the executing user of command. Not yet supported for Windows environments. |
||
| check_interval | Specifies the interval in minutes between check monitoring runs. If using an agent whose version is v0.67.0 or later, you may enter expressions such as 10m or 1h. Intervals allowed range from 1 minute to 60 minutes. Specified intervals under 1 minute will default to 1 minute, and intervals over 60 minutes will default to 60 minutes. |
1 minute | |
| timeout_seconds | The timeout period in seconds for the processing of the program specified by command. Set the value so that it does not exceed check_interval. |
30 seconds | |
| max_check_attempts | This specifies the maximum number of attempts. An alert will be generated in the event that a result besides OK is obtained for more times than the value specified here in succession. This defaults to 1 regardless of the value specified when used in conjunction with prevent_alert_auto_close. |
1 | |
| prevent_alert_auto_close | Normally, if the result of monitoring after an alert occurs is OK, the alert is automatically closed, but if this is true, it remains opened. max_check_attempts will always default to 1 when this is used in conjunction with max_check_attempts. |
false | |
| notification_interval | Specifies the alert notification retransmission interval in minutes. If the agent version is v0.67.0 or later, it can be expressed as 10m or 1h. If less than 10 minutes is specified, it is treated as 10 minutes. If not set, the notification will not be resent. |
null | |
| custom_identifier | This monitoring rule is treated as monitoring the host specified in custom_identifier, not the host running mackerel-agent. If the result of the monitoring is not OK, an alert will be issued for the host specified here. The custom_identifier can be found in the host details screen. This is useful when performing check monitoring on hosts where agents cannot be installed, such as hosts linked with AWS / Azure / Google Cloud integration. See AWS Integration Documentation for more information. |
null | |
| env | You can set environment variables. This is only valid for the command of the monitoring rule you set. |
null | |
| action | The action entered in this item will be executed after each execution of the command set in command. Please refer to How to write an action for more information. |
null | |
| memo | This allows a note to be set for the check monitor. You will see the string specified here in alert notifications as well as on the Alert Details screen and the Host Details screen. Up to 250 characters. | null |
How to write an action
You can write an action by entering the following items in the syntax "action = {}". Multiple items can be entered at the same time using a comma-delimited list.
| Setting | Description | Default value |
|---|---|---|
| command | This will be executed immediately after each execution of the command set in command. This is used to perform any further processing that is required depending on the execution results of the command. Environment variables described below may also be used. To distinguish it from the command in the monitoring rules, it is treated as action.command in this page. |
|
| env | This can be used to specify environment variables that are passed to action.command. The variables are specified as a Table or Inline Table in TOML format. |
null |
| user | This specifies the user by whom action.command is executed. This is not supported on Windows. |
root |
| timeout_seconds | The timeout period in seconds for processing action.command. |
30 seconds |
Example of action
action = { command = "bash -c '[ \"$MACKEREL_STATUS\" != \"OK\" ]' && ruby /path/to/notify_something.rb", env = { NOTIFY_API_KEY = "API_KEY" }, user = "someone", timeout_seconds = 45 }
Environment variables available with action
| Environment variable | Description |
|---|---|
| MACKEREL_STATUS | This is the execution result for the latest command. Possible values are OK, WARNING, CRITICAL, and UNKNOWN. max_check_attempts is not taken into account. |
| MACKEREL_PREVIOUS_STATUS | This is the execution result for the previous command. It will be an empty string for the first execution after the agent is launched. Possible values are OK, WARNING, CRITICAL, and UNKNOWN from the second execution onwards. max_check_attempts is not taken into account. |
| MACKEREL_CHECK_MESSAGE | This is the standard output result for the latest command. It may not be possible to obtain a result on Windows. |
Examples of environment variable usage
The following is a sample action configuration that executes a service startup or restart command with action.command when MACKEREL_STATUS is not OK.
Linux
action = { command = "bash -c '[ \"$MACKEREL_STATUS\" != \"OK\" ]' && systemctl restart SERVICE" }
Windows
action = { command = "if not %MACKEREL_STATUS% == OK ( net start SERVICE )" }
If the service name contains spaces, an error will occur with the net command if it is written as is, so use action.env and specify it in an environment variable.
action = { command = "if not %MACKEREL_STATUS% == OK ( net start %SERVICE% )", env = { SERVICE = "Sample Service" } }
Check plugin specs
Alert levels are returned as follows based on the exit status of command.
| Exit status | Alert level |
|---|---|
| 0 | OK |
| 1 | WARNING |
| 2 | CRITICAL |
| Any value besides 0, 1, or 2 | UNKNOWN |
The content written by the plugin to standard output will be displayed on the Host Details screen and the Alert Details screen. Please ensure that you do not include sensitive information such as passwords. The maximum message length is 1024 characters.
For more information on how to develop check plugins using github.com/mackerelio/checkers, the utility library used for the official check plugin, please refer to Creating a check plugin using checkers.
Check monitoring notifications
Notifications are sent when an alert is generated and when the status of an alert changes after it is generated. This includes cases in which the status becomes OK.
The following is an illustration of changes to an alert status and whether a notification will be sent for each status change.
| Check monitor execution attempt | 1st | 2nd | 3rd | 4th | 5th | 6th |
|---|---|---|---|---|---|---|
| Status | CRITICAL | WARNING | WARNING | CRITICAL | CRITICAL | OK |
| Alert notification | Yes | Yes | No | Yes | No | Yes |
In the event of changes to an alert status or the content of a message, this information will also be reflected on the Alert Details screen. No notification will be sent if only the content of a message has changed.
Differences between metric monitoring and check monitoring
Metric monitoring, such as the monitoring of host metrics and service metrics, differs from check monitoring in the following ways.
- Metric monitoring
- The host posts metric values to Mackerel, which compares them to the threshold values before generating alert notifications accordingly.
- Metrics are plotted as graphs.
- Monitoring rules may be configured via the Web Console or Web API.
- There is no charge for adding monitoring rules. (Charges apply only to the metrics.)
- Check monitoring
- The host where the check plugin is run will make an OK or CRITICAL, WARNING, UNKNOWN decision and send the result to Mackerel. Mackerel will alert you according to the results it receives.
- No metrics are posts, so no graphs are plotted.
- Monitoring rules are configured within the mackerel-agent configuration file, and no configuration may be added or modified via the Web Console.
- Each check monitor item counts as one host metric. Please refer to Pricing for more information on the maximum number of metrics allowed per host. Also, please refer to How usage fees are calculated for more information on the specifications when the limit is exceeded.
- Illustrations of monitoring
-[Left] Metric monitoring / [Right] Check monitoring
Sample check plugin
The following examples demonstrate a check plugin that counts the number of files (excluding directories) in a directory passed as an argument and raises alerts when the file count exceeds defined thresholds.
- Issues a WARNING alert when the number of files exceeds 50, and a CRITICAL alert when it exceeds 100.
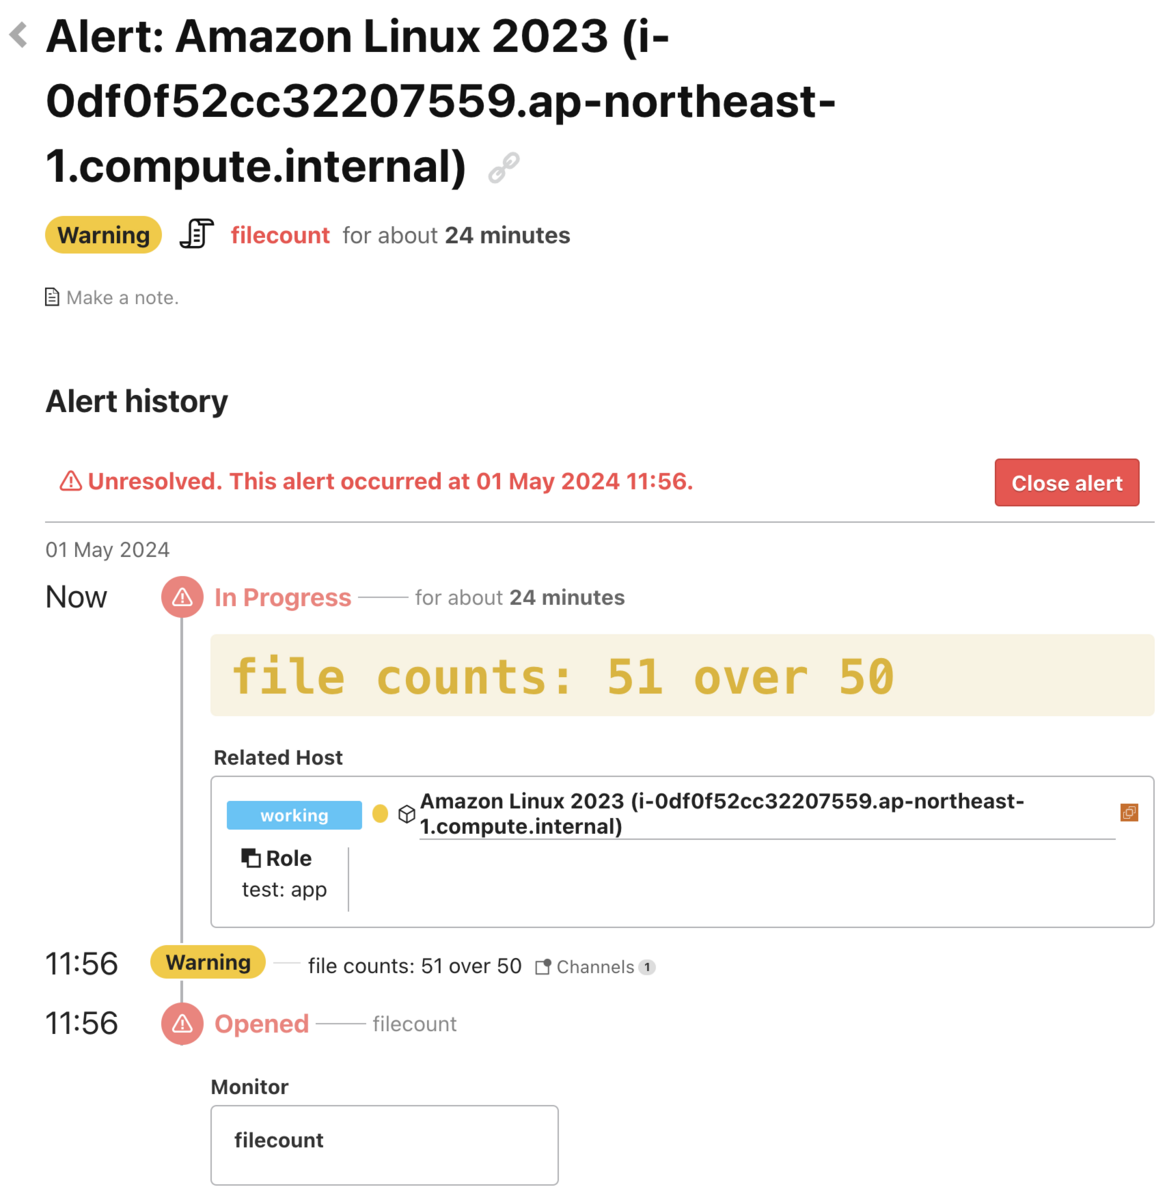
- A message such as "file counts: 51 (current file count) over 50" will be displayed in the Alert Details screen.
- When specifying paths in mackerel-agent.conf on Windows, backslashes (
\) used as path separators must be escaped with an additional backslash. For example,C:\should be written asC:\\.
Shell script
#!/bin/bash
FILECOUNT=$(ls -1 $1 | wc -l)

if [ "$FILECOUNT" -gt 100 ]; then
    echo "file counts: $FILECOUNT over 100"
    exit 2
elif [ "$FILECOUNT" -gt 50 ]; then
    echo "file counts: $FILECOUNT over 50"
    exit 1
else
    echo "file counts: $FILECOUNT"
    exit 0
fi
Configuration in mackerel-agent.conf
[plugin.checks.filecount]
command = ["/path/filecount.sh", "/path"]
PowerShell
$FILECOUNT =  (Get-ChildItem -Path $Args[0] | Where-Object { ! $_.PSIsContainer }).Count

if($FILECOUNT -gt 100) {
    Write-Host "file counts: $FILECOUNT over 100"
    exit 2
} elseif($FILECOUNT -gt 50) {
    Write-Host "file counts: $FILECOUNT over 50"
    exit 1
} else {
    Write-Host "file counts: $FILECOUNT"
    exit 0
}
Configuration in mackerel-agent.conf
[plugin.checks.filecount]
command = ["powershell", "-File", "C:\\path\\filecount.ps1", "C:\\path"]
Windows batch file
@echo off
setlocal
for /f "usebackq" %%i in (`dir %1 /a-d /b ^| find /c /v ""`) do set FILECOUNT=%%i

if %FILECOUNT% gtr 100 (
    echo file counts: %FILECOUNT% over 100
    exit /b 2
) else if %FILECOUNT% gtr 50 (
    echo file counts: %FILECOUNT% over 50
    exit /b 1
) else (
    echo file counts: %FILECOUNT%
    exit /b 0
)
Configuration in mackerel-agent.conf
[plugin.checks.filecount]
command = ["C:\\path\\filecount.bat", "C:\\path"]
How to confirm
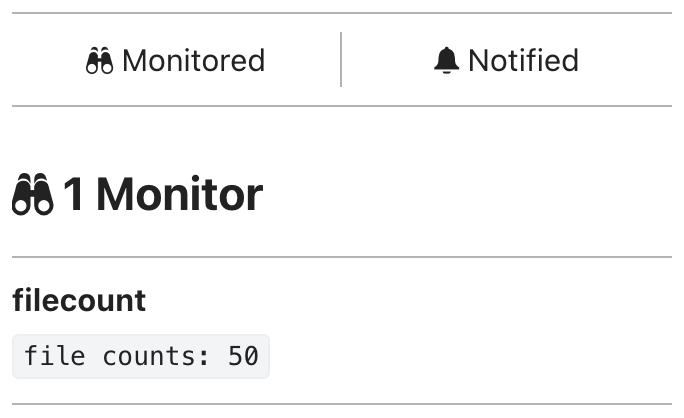
Check monitoring will be displayed in the host details screen as shown below.

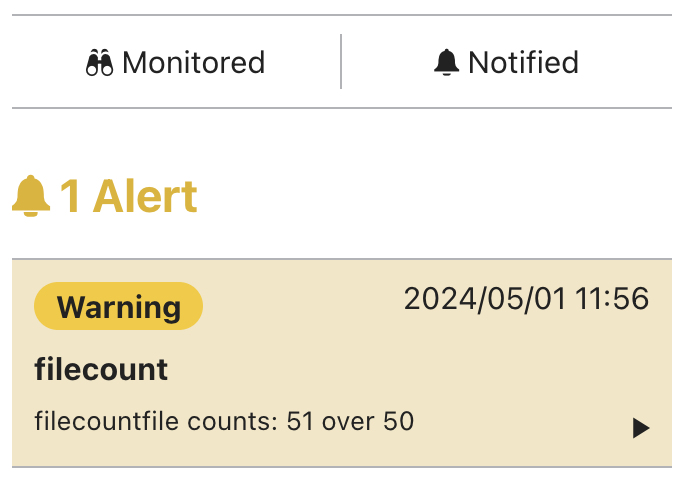
When an alert is raised, the display will change as shown below. Clicking on it will take you to the Alert Details screen.


