- How to View Graphs
- Change the display period of a graph
- Select a metric to display on the graph
- Simplified Display
- Creating graph annotations
- Make a graph full-screen
- Posting graphs to notification channels
- Sharing graphs
- Change the details displayed for a graph
- Delete graph definitions
How to View Graphs
Graphs are divided into two sections. The upper section is for viewing data in close detail while the lower section displays a more broad, wide-ranged view. Inside the graph, metrics are displayed as color coded lines.
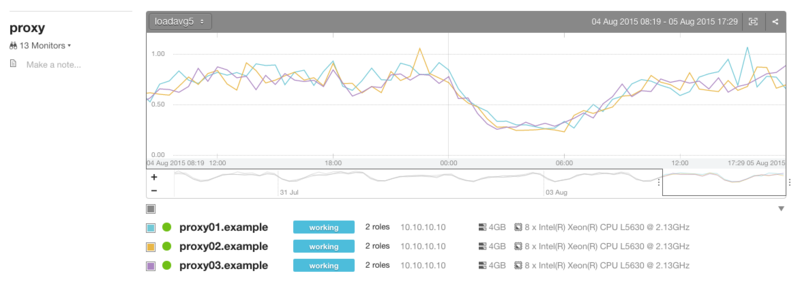
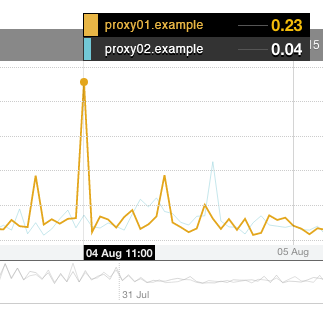
By mousing over any point on a graphed line, you can see detailed information about a metric at any particular moment.
Change the display period of a graph
The lower portion of the graph has a slider which can be used to quickly track forward and backward as well as zoom in and out.
Displayed at the top of the page are the time span control buttons. Using these controls you can change the time interval graphs will display.

You can specify the time period with the clock icon.

Select a metric to display on the graph
Click on a metric name shown beneath the graph to show or hide that metric.

Simplified Display
Any role graph from the Services detail screen with a large number of hosts (more than 30) is simplified. Stacked graphs display the sum and line graphs display the maximum, minimum, and average. By clicking "show all hosts" located at the bottom of the graph, a detailed version of the simplified graph can be seen.

In the opened up graph detail screen, graphs with more than 200 hosts are always simplified, but can be switched from the "simplify graph" checkbox.

Creating graph annotations
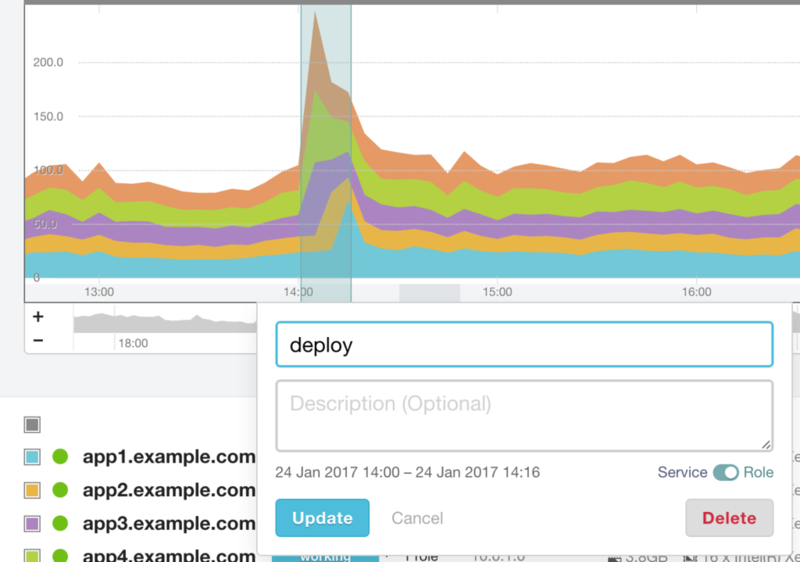
Leave arbitrary information on graphs. You can do this by dragging over a section of the graph, specifying the period to be annotated, then entering a title and description.
Graph annotations can be created for service metric graphs and role graphs. Leaving annotations can be really useful regarding the deployment/release of applications performed on a per-service and per-role basis.
Make a graph full-screen
Clicking on the Full Screen button in the upper right corner of the graph will display that graph in a new window or tab in full screen mode.

Posting graphs to notification channels
Graph URLs can be posted to notification channels directly from Mackerel. From the graph menu, click the camera icon, select a channel to send the graph URL to, and then press “Post”. By doing this, the URL will be posted collectively with the graph information.


If you select a metric to display (Select a metric to display on the graph), it will share a graph showing the status of that metric. This does not yet support embedded graphs like alert graphs, dashboards, etc., and preview graphs for monitoring with expressions are not currently supported.
To use this feature, you need to set a notification channel in advance. The following notification channels are currently supported for submissions.
- Slack
- Chatwork
- Microsoft Teams
Sharing graphs
Graphs can be shared with others in a variety of ways. Display the graph sharing menu by clicking the share button located on each graph.


Downloading images
Graph images can be downloaded by clicking the download button. The display range of the graph image is the same as the range displayed on the console.
Sharing URLs You can generate a URL to display a graph. Graphs can be shared using these URLs. The display range of a shared graph can be made to match the range displayed on the console by checking the "Current Display Range" box. Only accounts that belong to that organization can view the graph with this URL.
Select the embedded format and share
Get information for sharing graphs in embedded formats for HTML or markdown documents. The following formats can be selected.
- iframe
- Image
- SVG
- Markdown
Only accounts that belong to that organization can view embedded graphs. The display range of the shared graph can be made to match the range displayed on the console by checking the "Current Display Range" box.
Publishing graphs Graphs can be made public by clicking the "Create URL" button.Anyone with access to a public URL will be able to see the graph, so please be careful.
You can check on your shared graphs or stop sharing from the Shared Graphs tab.
Change the details displayed for a graph
Click on the gear icon in the upper right corner of a custom metric graph to open the Graph Definition screen. This screen allows you to change what is displayed for your graphs.


You can hide graphs with the "Delete this graph" button. The graph will reappear when a new custom metric for that graph is posted.
Delete graph definitions
You can delete unneeded graph definitions from the Graph Definition List screen. The Graph Definition List screen can be accessed from "Settings" on the right side of the Custom Metrics heading on the Host Details screen.

Note that graph definitions are settings owned by the organization. Deleting them will affect all hosts.