Using GraphBoards
GraphBoards is a feature that let’s you create a board where users can freely add graphs linked to services. Graphs within the GraphBoard can be rearranged, deleted, and memos viewed.
There are currently two types of graphs that you can add to GraphBoards: role graphs and service metrics graphs.
Create a new GraphBoard
A GraphBoard can be created from tab displayed in the service screen. Click the + button on the right side of the tab list to open the GraphBoard creation modal window.

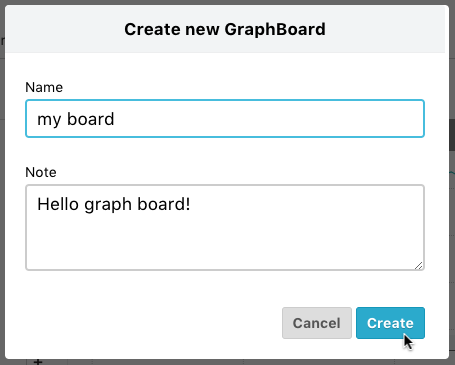
When creating a new GraphBoard, you can specify the name and a leave note as well. After entering a name and pressing the “Create” button, a GraphBoard is created and a new tab is added to the right side of the tab list.
Add a graph to the GraphBoard
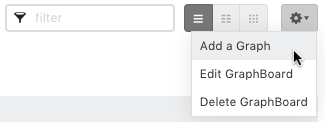
Any role graph or service metrics graph within the service can be added to the GraphBoard. To add a graph, select “Add graph” from the gear icon in the upper right to open the graph addition modal window.
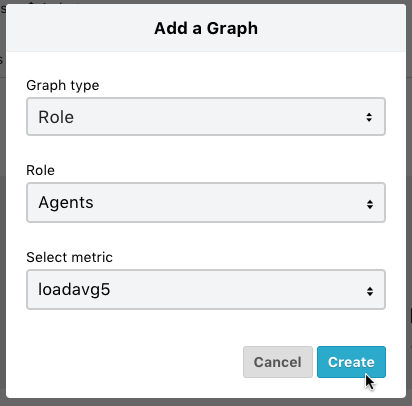
When adding a role graph, select “Role” for the graph type and then select the role and metrics. When adding a service metrics graph, select “Service” as the graph type and then select the metrics.
After specifying the metrics and pressing the “Create” button, the graph is added to the end of the GraphBoard.
Rearrange graphs within the GraphBoard
In the GraphBoard, graphs can be rearranged by dragging and dropping. By dragging the handle in the upper left corner of the graph and dropping the graph to the desired position, the graphs will be rearranged.
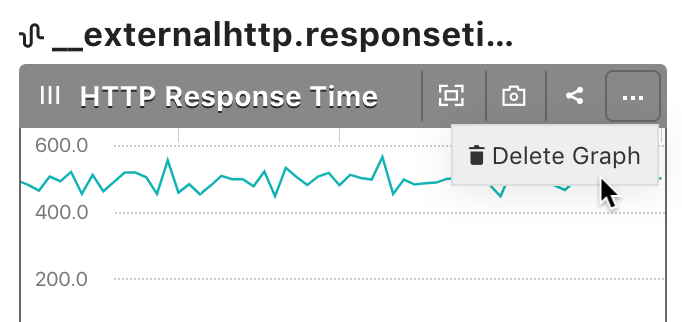
Delete graphs within the GraphBoard
To delete a graph from the GraphBoard, select “Delete Graph” from the pull-down menu at the top right of the graph.
Change the name of the GraphBoard
To change the name of the GraphBoard, select “Edit GraphBoard” from the gear icon in the upper right.
Delete the GraphBoard
To delete a GraphBoard, select “Delete GraphBoard” from the gear icon in the upper right.