By writing a simple expression in query parameters for expanded graph permalink URLs, it's possible to display flexible, function-based graphs. (experimental feature)
Expanded graph permalinks can be used as demonstrated here https://mackerel.io/orgs/<organization name>/advanced-graph?query=<metric>&unit=<unit>&title=<title>. (title and unit parameters can be omitted)
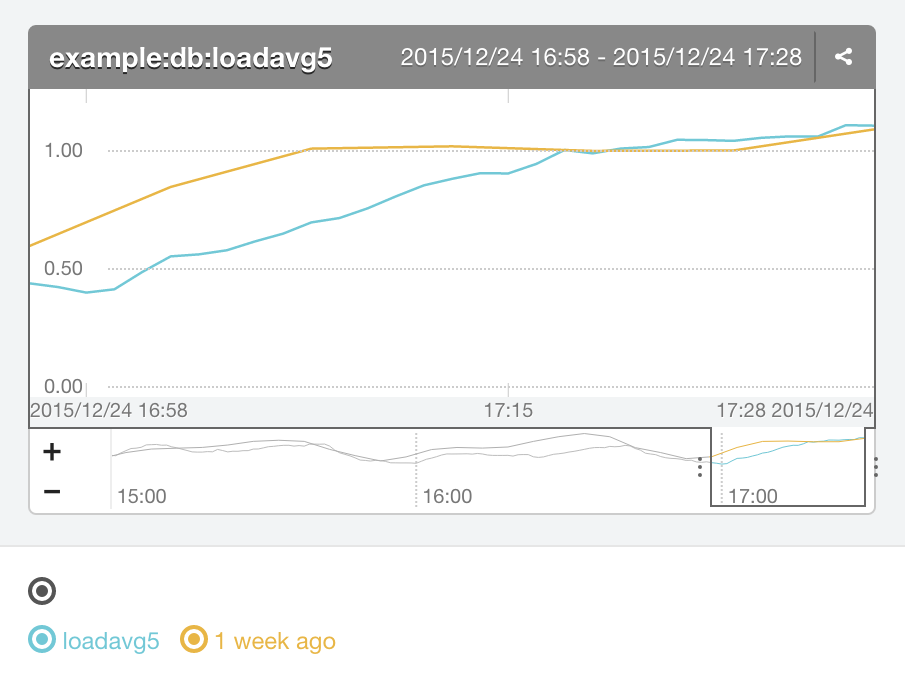
Example
This is an overlay of an the average value of the loadavg5 metric of the role db in the service example of the organization example, and the same metric from one week prior.
query: group(alias(avg(role(example:db, loadavg5)), 'loadavg5'),
             alias(timeShift(avg(role(example:db, loadavg5)), 1w), '1 week ago'))
URL: https://mackerel.io/orgs/example/advanced-graph
       ?query=group(alias(avg(role(example:db, loadavg5)), 'loadavg5'),
                    alias(timeShift(avg(role(example:db, loadavg5)), 1w), '1%20week%20ago'))
       &title=example:db:loadavg5
Functions that can be used with expanded graph permalinks
| Function | Explanation | Example |
|---|---|---|
host(hostId, metricName) |
Returns host metrics. | host(22CXRB3pZmu, memory.*) |
service(serviceName, metricName) |
Returns service metrics. | service(Blog, access_count) |
role(roleFullname, metricName) |
Returns host metrics that currently belong to a role. | role(Blog:db, memory.*) |
roleSlots(roleFullname, metricName) |
Returns a role's metrics. Metrics sent from hosts that used to belong to a role in the past can also be gotten. Every custom metric and some system metrics*1 can be used. | roleSlots(Blog:db, loadavg5) |
avg(metrics) |
Returns an average of metrics of an argument for each point in time. | avg(group(host(22CXRB3pZmu, loadavg5), host(22CXRB3pZmu, loadavg5))) |
max(metrics) |
Returns the largest metric value of an argument for each point in time. | max(host(22CXRB3pZmu, custom.foo.jobs.*)) |
min(metrics) |
Returns the smallest metric value of an argument for each point in time. | min(host(22CXRB3pZmu, custom.foo.jobs.*)) |
sum(metrics) |
Returns the sum total of metrics of an argument for each point in time. | sum(host(22CXRB3pZmu, custom.foo.jobs.*)) |
product(metrics) |
Returns the multiplied total of metrics of an argument for each point in time. | product(group(service(Blog, foo.bar), service(Blog, foo.baz))) |
diff(metrics, metrics) |
Returns the first metric minus the second metric of an argument for each point in time. | diff(service(Blog, foo.bar), service(Blog, foo.baz)) |
divide(metrics, metrics) |
Returns the first metric divided by the second metric of an argument for each point in time. | divide(service(Blog, foo.bar), service(Blog, foo.baz)) |
scale(metrics, factor) |
Returns metrics doubled a fixed number of times. | scale(service(Blog, foo.bar), 10.0) |
offset(metrics, factor) |
Returns metrics added a fixed number. | offset(service(Blog, foo.bar), 10.0) |
percentile(metrics, percentage) |
Returns the percentage percentile value of the metrics given as the argument for each point in time. |
percentile(role(Blog:db, loadavg5), 80) |
timeShift(metrics, duration) |
Returns metrics shifted by a designated amount of time. | timeShift(service(Blog, foo.bar), 1d) |
movingAverage(metrics, duration) |
The average movement. | movingAverage(service(Blog, foo.bar), 1d) |
linearRegression(metrics, duration) |
Returns linear regression metrics based on the metric value from the current time until before duration |
linearRegression(host(22CXRB3pZmu, loadavg5), 7d) |
timeLeftForecast(metrics, duration, threshold) |
Returns the number of seconds remaining until the linear regression value reaches the threshold, based on the metric value from the current time until before duration |
scale(timeLeftForecast(host(22CXRB3pZmu, cpu.system.percentage), 7d, 10), 1/86400) |
group(metrics, metrics, ...) |
Compiles argument metrics into one line. | group(service(Blog, foo.bar), service(Blog, foo.baz)) |
stack(metrics) |
Displays graph in stack mode. | stack(service(Blog, foo.bar)) |
alias(metrics, displayName) |
Customizes a metric's display name. | alias(service(Blog, foo.bar), 'Blog foo bar') |
*1 loadavg5, processor_queue_length, cpu.user.percentage, cpu.iowait.percentage, cpu.system.percentage, interface.rxBytes.delta, interface.txBytes.delta, disk.reads.delta, disk.writes.delta, memory.used, memory.cached, container.cpu.usage, container.memory.usage
All functions will return metrics. The parameters of the functions' arguments are as follows.
| Argument | Type | Explanation | Example |
|---|---|---|---|
| hostId | string | host ID | 22CXRB3pZmu, '22CXRB3pZmu', "22CXRB3pZmu" |
| metricName | string | metric name | loadavg5, 'loadavg5' |
| serviceName | string | service name | Blog, 'Blog' |
| roleFullname | string | service name and role connected with a : |
Blog:db, 'Blog:db' |
| metrics | metrics | metrics line | alias(host(22CXRB3pZmu, loadavg5), 'L5') |
| displayName | string | display name | 'blog max loadavg5' |
| duration | string | Duration is specified as an integer followed by the unit of time. Time units that can be used are m(minutes), h(hours), d(days), w(weeks), mo(months), and y(years). | 5m, 1d |
| factor | float | factor | 1.5, 200, 1/86400 |
| threshold | float | threshold | 1.5, 200, 1/86400 |
| percentage | float | percentage (0 < percentage < 100) |
80, 99.9 |