This page explains how to send traces from Ruby applications to Mackerel.
Overview
Mackerel collects traces using the OpenTelemetry mechanism (instrumentation). By using the instrumentation libraries provided for major frameworks and libraries such as Ruby on Rails and ActiveRecord, you can send traces without significantly modifying your existing implementation.
There are several web frameworks available for Ruby, but this page explains how to get started with Ruby on Rails.
📝 Note
Available instrumentation libraries can be searched in the registry. If there is no instrumentation library for your framework or application, you can implement manual instrumentation. For more details, see Instrumentation in the official OpenTelemetry documentation.
Requirements
According to the OpenTelemetry prerequisites, the following must be installed.
- One of the following:
- CRuby 3.1 or higher
- JRuby 9.3.2.0 or higher
- TruffleRuby 22.1 or higher
- Bundler
Installation
To send traces from your application to Mackerel, do the following:
- Add the gems
- Initialize settings in initializers
- Catch error details (optional)
1. Add the gems
The following gems automatically instrument requests to Ruby on Rails and queries to the database.
gem 'opentelemetry-sdk'
gem 'opentelemetry-exporter-otlp'
gem 'opentelemetry-instrumentation-all'
Also, since opentelemetry-instrumentation-all includes many gems, you can use only the individual gems as shown below.
gem 'opentelemetry-instrumentation-active_support'
gem 'opentelemetry-instrumentation-active_record'
gem 'opentelemetry-instrumentation-rack'
gem 'opentelemetry-instrumentation-rails'
2. Initialize settings in initializers
Configure settings in initializers to send traces. Place the following in config/initializers/opentelemetry.rb and start the application to send traces.
require 'socket'
require 'opentelemetry/sdk'
require 'opentelemetry/exporter/otlp'
require 'opentelemetry/instrumentation/all'

OpenTelemetry::SDK.configure do |c|
  c.service_name = "my-sample-app"
  c.service_version = "vX.Y.Z"
  c.resource = OpenTelemetry::SDK::Resources::Resource.create(
    OpenTelemetry::SemanticConventions::Resource::DEPLOYMENT_ENVIRONMENT => Rails.env.to_s,
    OpenTelemetry::SemanticConventions::Resource::HOST_NAME => Socket.gethostname
  )

  # exporter settings
  exporter = OpenTelemetry::Exporter::OTLP::Exporter.new(
    endpoint: "https://otlp-vaxila.mackerelio.com/v1/traces",
    headers: {
      "Accept" => "*/*",
      "Mackerel-Api-Key" => ENV["MACKEREL_APIKEY"]
    }
  )
  # exporter = OpenTelemetry::SDK::Trace::Export::ConsoleSpanExporter.new

  c.add_span_processor(
    OpenTelemetry::SDK::Trace::Export::BatchSpanProcessor.new(exporter)
  )

  # When using c.use_all, the gems to use are automatically determined.
  c.use_all

  # You can also explicitly specify the instrumentation target using c.use(...).
  # c.use('OpenTelemetry::Instrumentation::ActiveRecord')
  # c.use('OpenTelemetry::Instrumentation::Mysql2')
  # c.use('OpenTelemetry::Instrumentation::Rails')
  # ...
end
service_nameis the service name of the trace (the value of theservice.nameattribute).service_versioncan include version information (optional).resourcecan specify attributes based on the OpenTelemetry semantic conventions. This allows for detailed identification of the trace source (optional).DEPLOYMENT_ENVIRONMENT: Specifies the deployment environment (development, staging, production, etc.). This example uses the Rails environment name (Rails.env).HOST_NAME: Specifies the hostname where the application is running. This example usesSocket.gethostnameto automatically retrieve the hostname.- For other attributes, see OpenTelemetry::SemanticConventions::Resource.
exporterendpointspecifies the destination for sending traces.- To send directly to Mackerel, specify
https://otlp-vaxila.mackerelio.com/v1/traces. - To send via a Collector, specify
http://<Collector address:port>/v1/traces.
- To send directly to Mackerel, specify
${MACKEREL_APIKEY}specifies the Mackerel API key. Define an API key with Write permission from the API key list as an environment variable in the system where the application runs.- It will work if you write the API key directly instead of using an environment variable.
- Specifying
ConsoleSpanExporterwill output traces to standard output.
3. Catch error details (optional)
Mackerel can track errors, but Ruby's OpenTelemetry does not send error details by default.
To send error details, you need to catch errors and record them in a span using one of the following methods.
- Catch errors using
rescue_from - Catch errors using Middleware
For example, if you use rescue_from, you would do the following.
class ApplicationController < ActionController::API
  rescue_from Exception do |e|
    OpenTelemetry::Trace.current_span.record_exception(e)

    raise e
  end
end
Viewing sent traces
Sent traces can be verified by following these steps:
- Select "APM" from the menu
- Select the service name
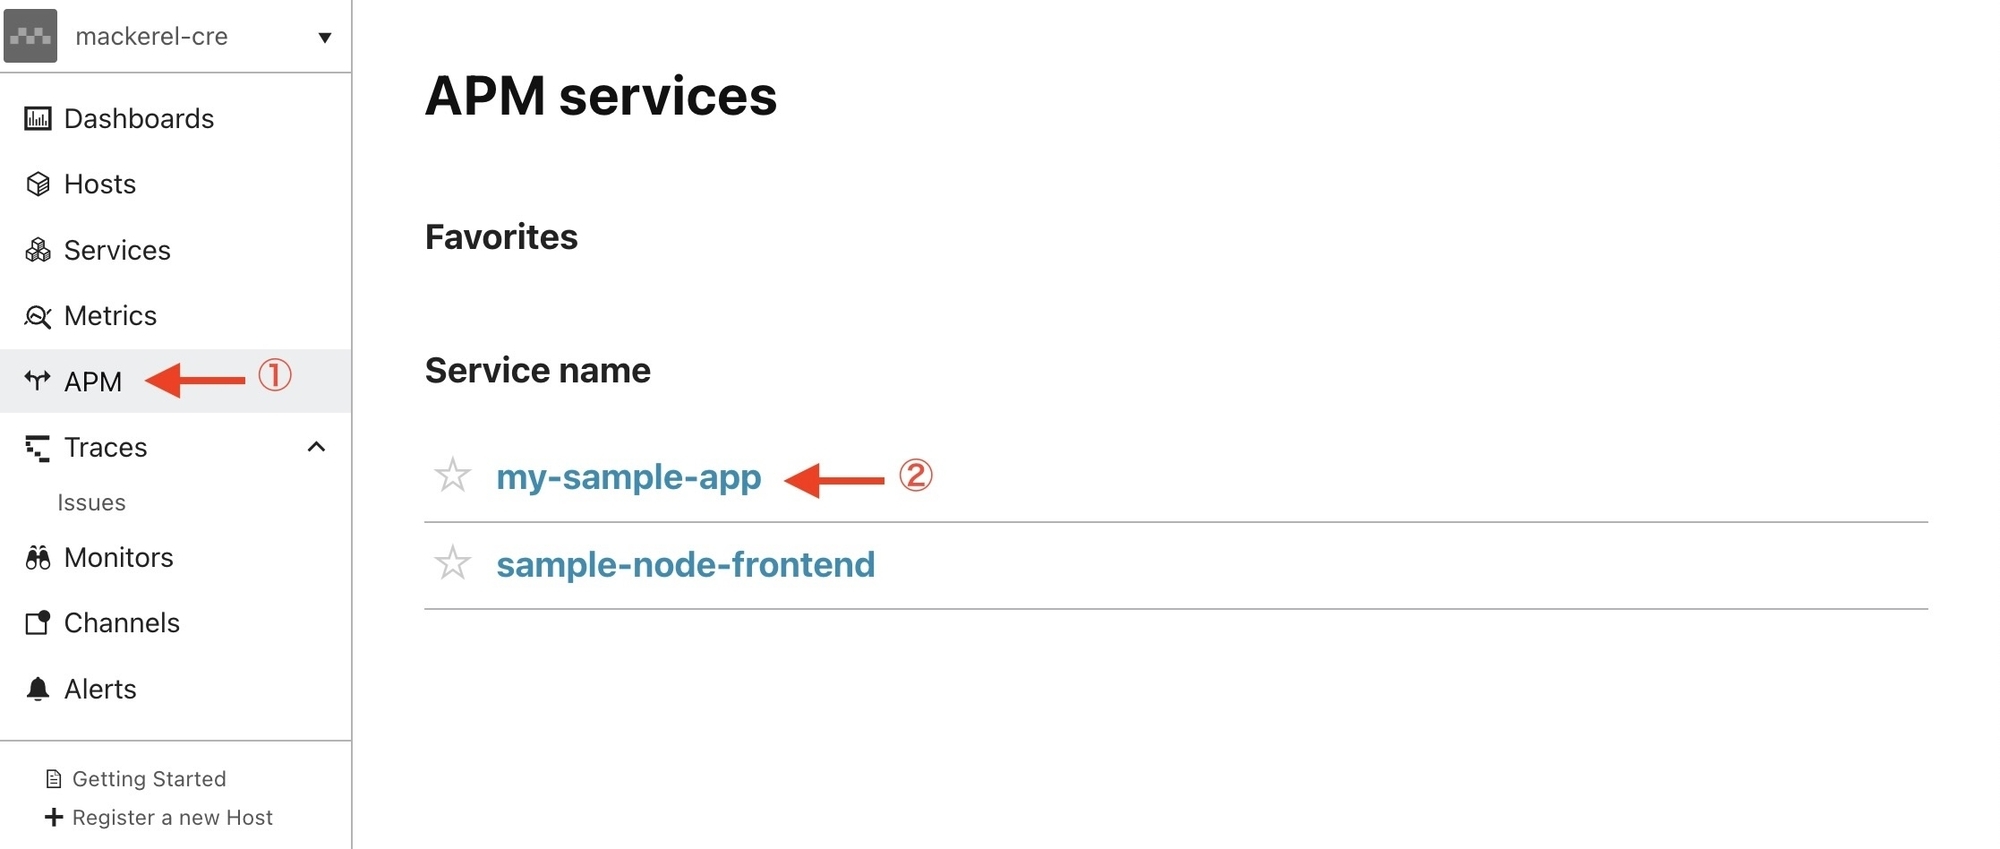
- Select the "Traces" tab
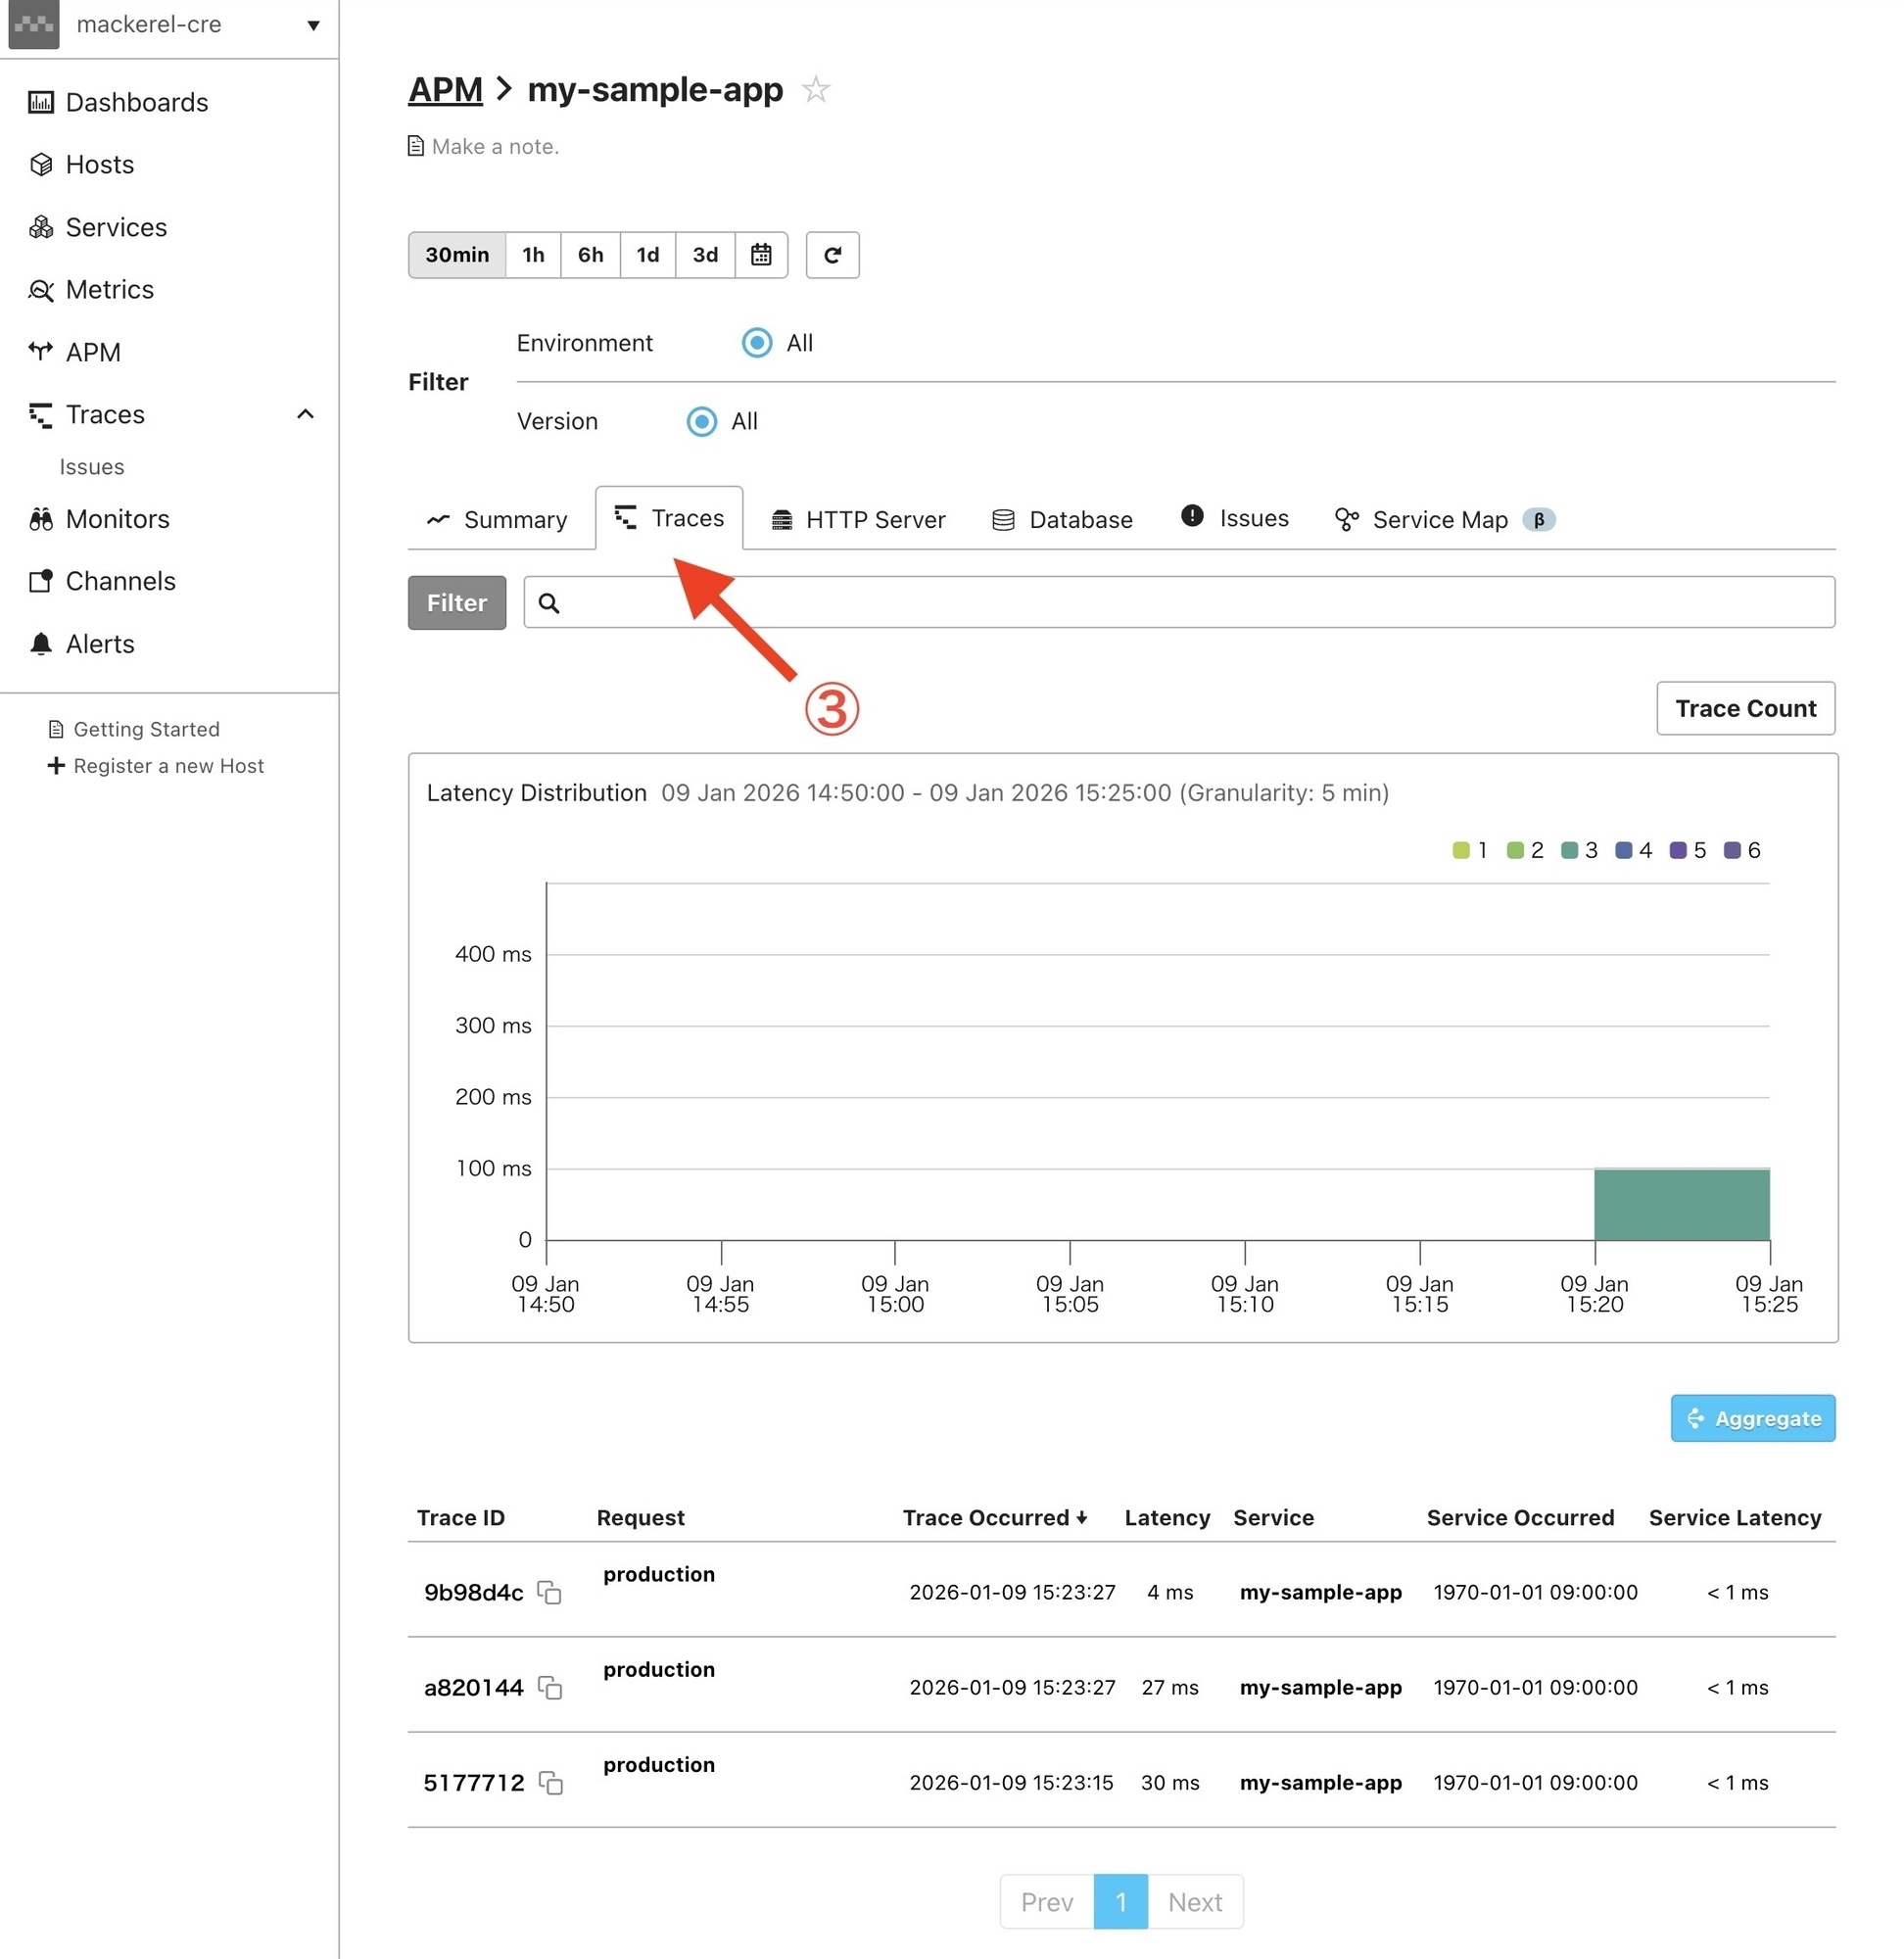
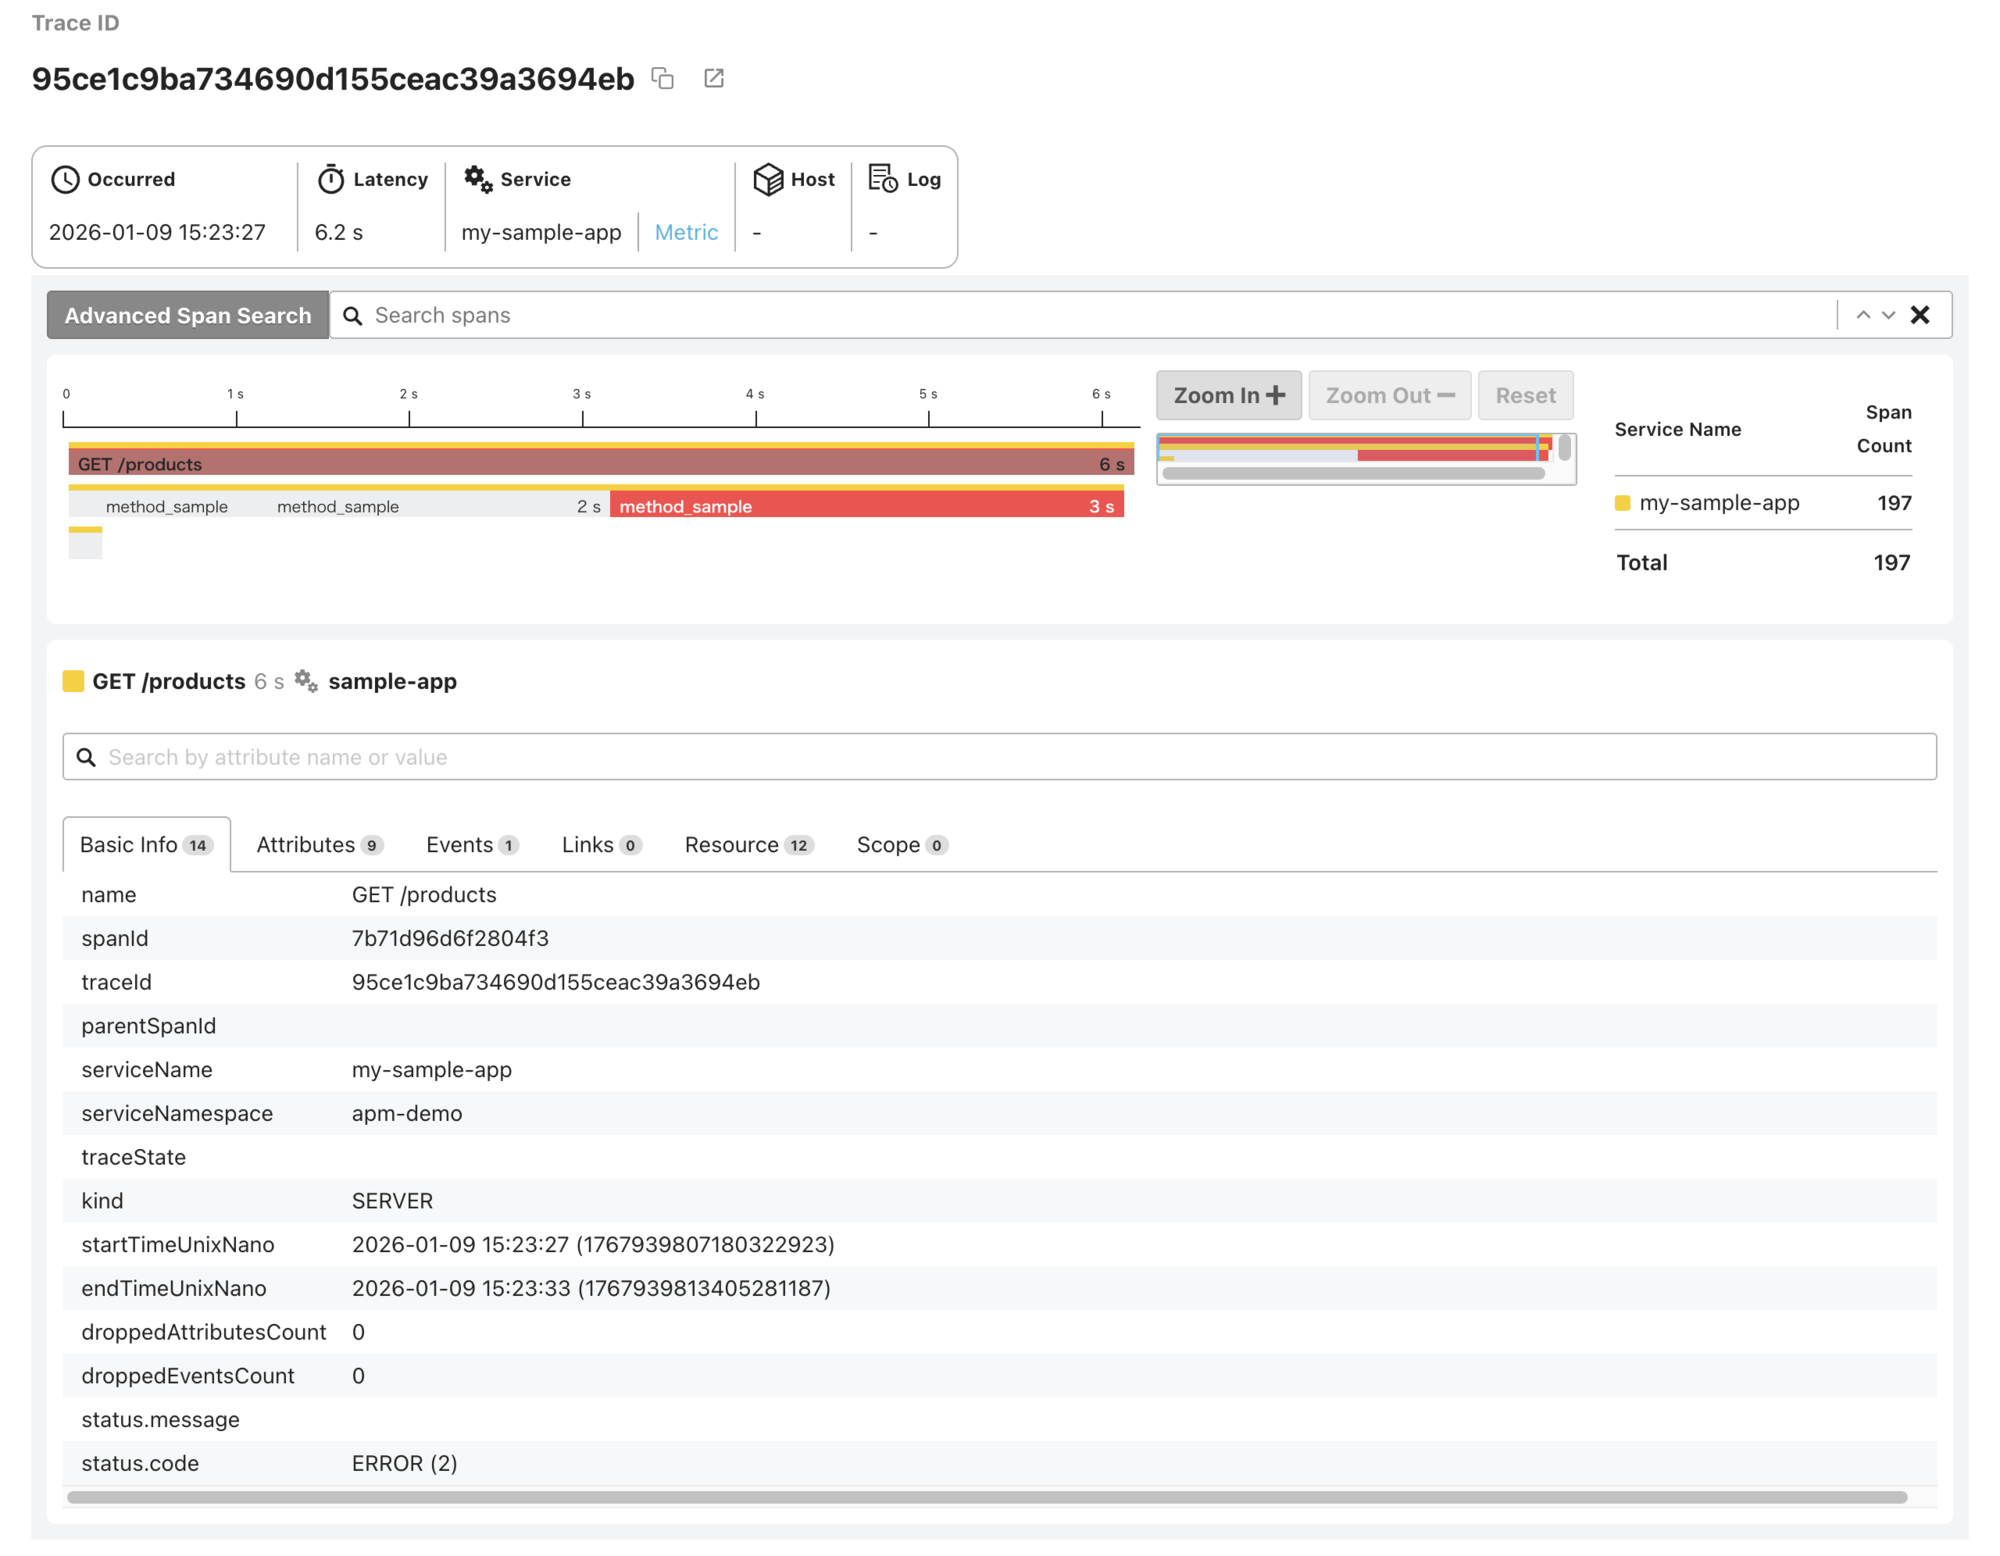
- Select a trace from the trace list to view its details
That's a wrap on setting up OpenTelemetry in your Ruby application and sending traces to Mackerel.