This page explains how to send traces from Python applications to Mackerel.
Overview
Mackerel collects traces using the OpenTelemetry mechanism (instrumentation). While there are various ways to collect OpenTelemetry-compatible traces, this page explains zero-code instrumentation, a method that allows you to send traces without modifying your application's implementation.
📝 Note
Python zero-code instrumentation is achieved by using an agent that modifies library functions at runtime, allowing you to collect telemetry data such as traces without changing your code. For more details, see Python zero-code instrumentation.
Requirements
According to the OpenTelemetry Version support, Python must be the specified version or higher.
- Python 3.9 or higher
Installation
To send traces from your application to Mackerel, do the following:
- Install packages
- Run your application through the agent
1. Install packages
Run the following command to install the necessary packages for using OpenTelemetry for Python.
pip install opentelemetry-distro opentelemetry-exporter-otlp
Next, use the opentelemetry-bootstrap command to install the instrumentation libraries that match the packages in your site-packages folder.
opentelemetry-bootstrap -a install
OpenTelemetry supports many Python packages and provides individual instrumentation libraries for each of them. Available packages can be searched on the following page.
📝 Note
If there is no instrumentation library for your framework or application, you can implement manual instrumentation. For more details, see Instrumentation | OpenTelemetry in the official OpenTelemetry documentation.
2. Run your application through the agent
When using zero-code instrumentation, you can automatically send traces from your application by running it through opentelemetry-instrument.
By setting your Mackerel API key with write permissions in the MACKEREL_APIKEY environment variable and executing the command below, you can send your traces on Mackerel under the service name my-sample-app.
opentelemetry-instrument \
    --traces_exporter otlp \
    --metrics_exporter none \
    --logs_exporter none \
    --service_name my-sample-app \
    --exporter_otlp_traces_endpoint https://otlp-vaxila.mackerelio.com/v1/traces \
    --exporter_otlp_traces_headers "Mackerel-Api-Key=${MACKEREL_APIKEY},Accept='*/*'" \
    --exporter_otlp_traces_protocol http/protobuf \
    python myapp.py  # Replace this line with your application's startup command.
- Setting
--traces_exportertoconsolewill output traces to standard output. --service_nameis the service name of the trace (the value of theservice.nameattribute).--exporter_otlp_traces_endpointspecifies the destination for sending traces.- To send directly to Mackerel, specify
https://otlp-vaxila.mackerelio.com/v1/traces. - To send via a Collector, specify
http://<Collector address:port>/v1/traces.
- To send directly to Mackerel, specify
${MACKEREL_APIKEY}specifies the Mackerel API key. Define an API key with Write permission from the API key list as an environment variable in the system where the application runs.- It will work if you write the API key directly instead of using an environment variable.
Viewing sent traces
Sent traces can be verified by following these steps:
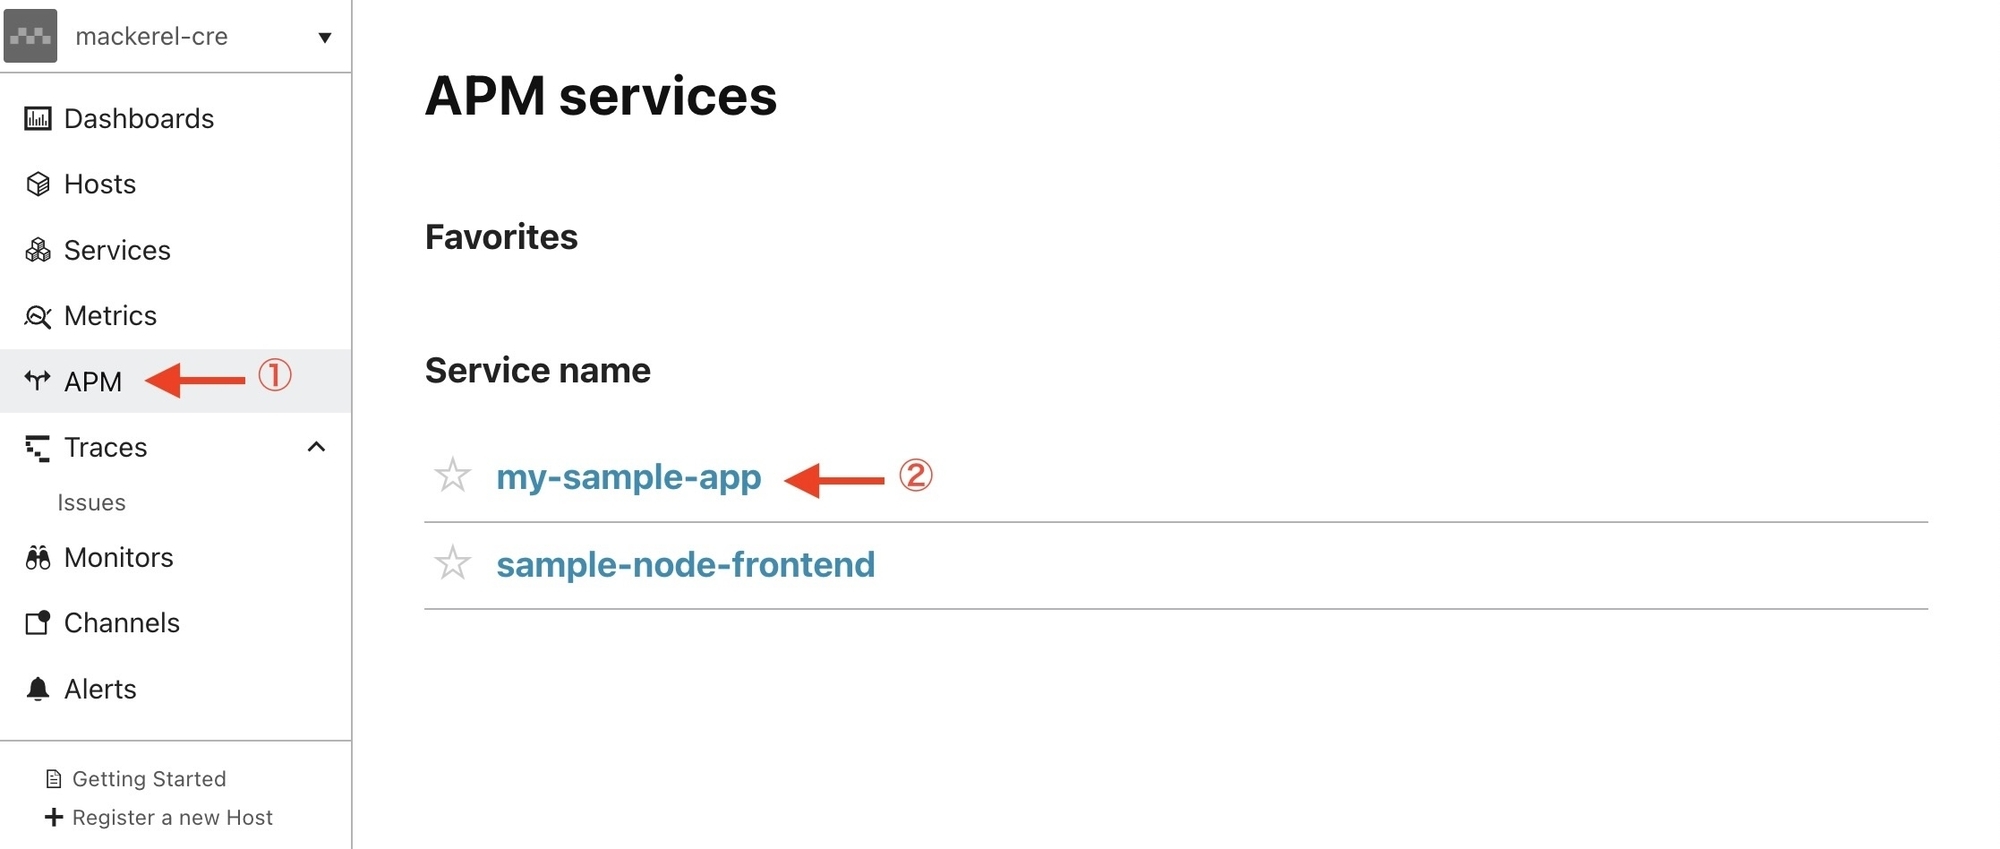
- Select "APM" from the menu
- Select the service name
- Select the "Traces" tab
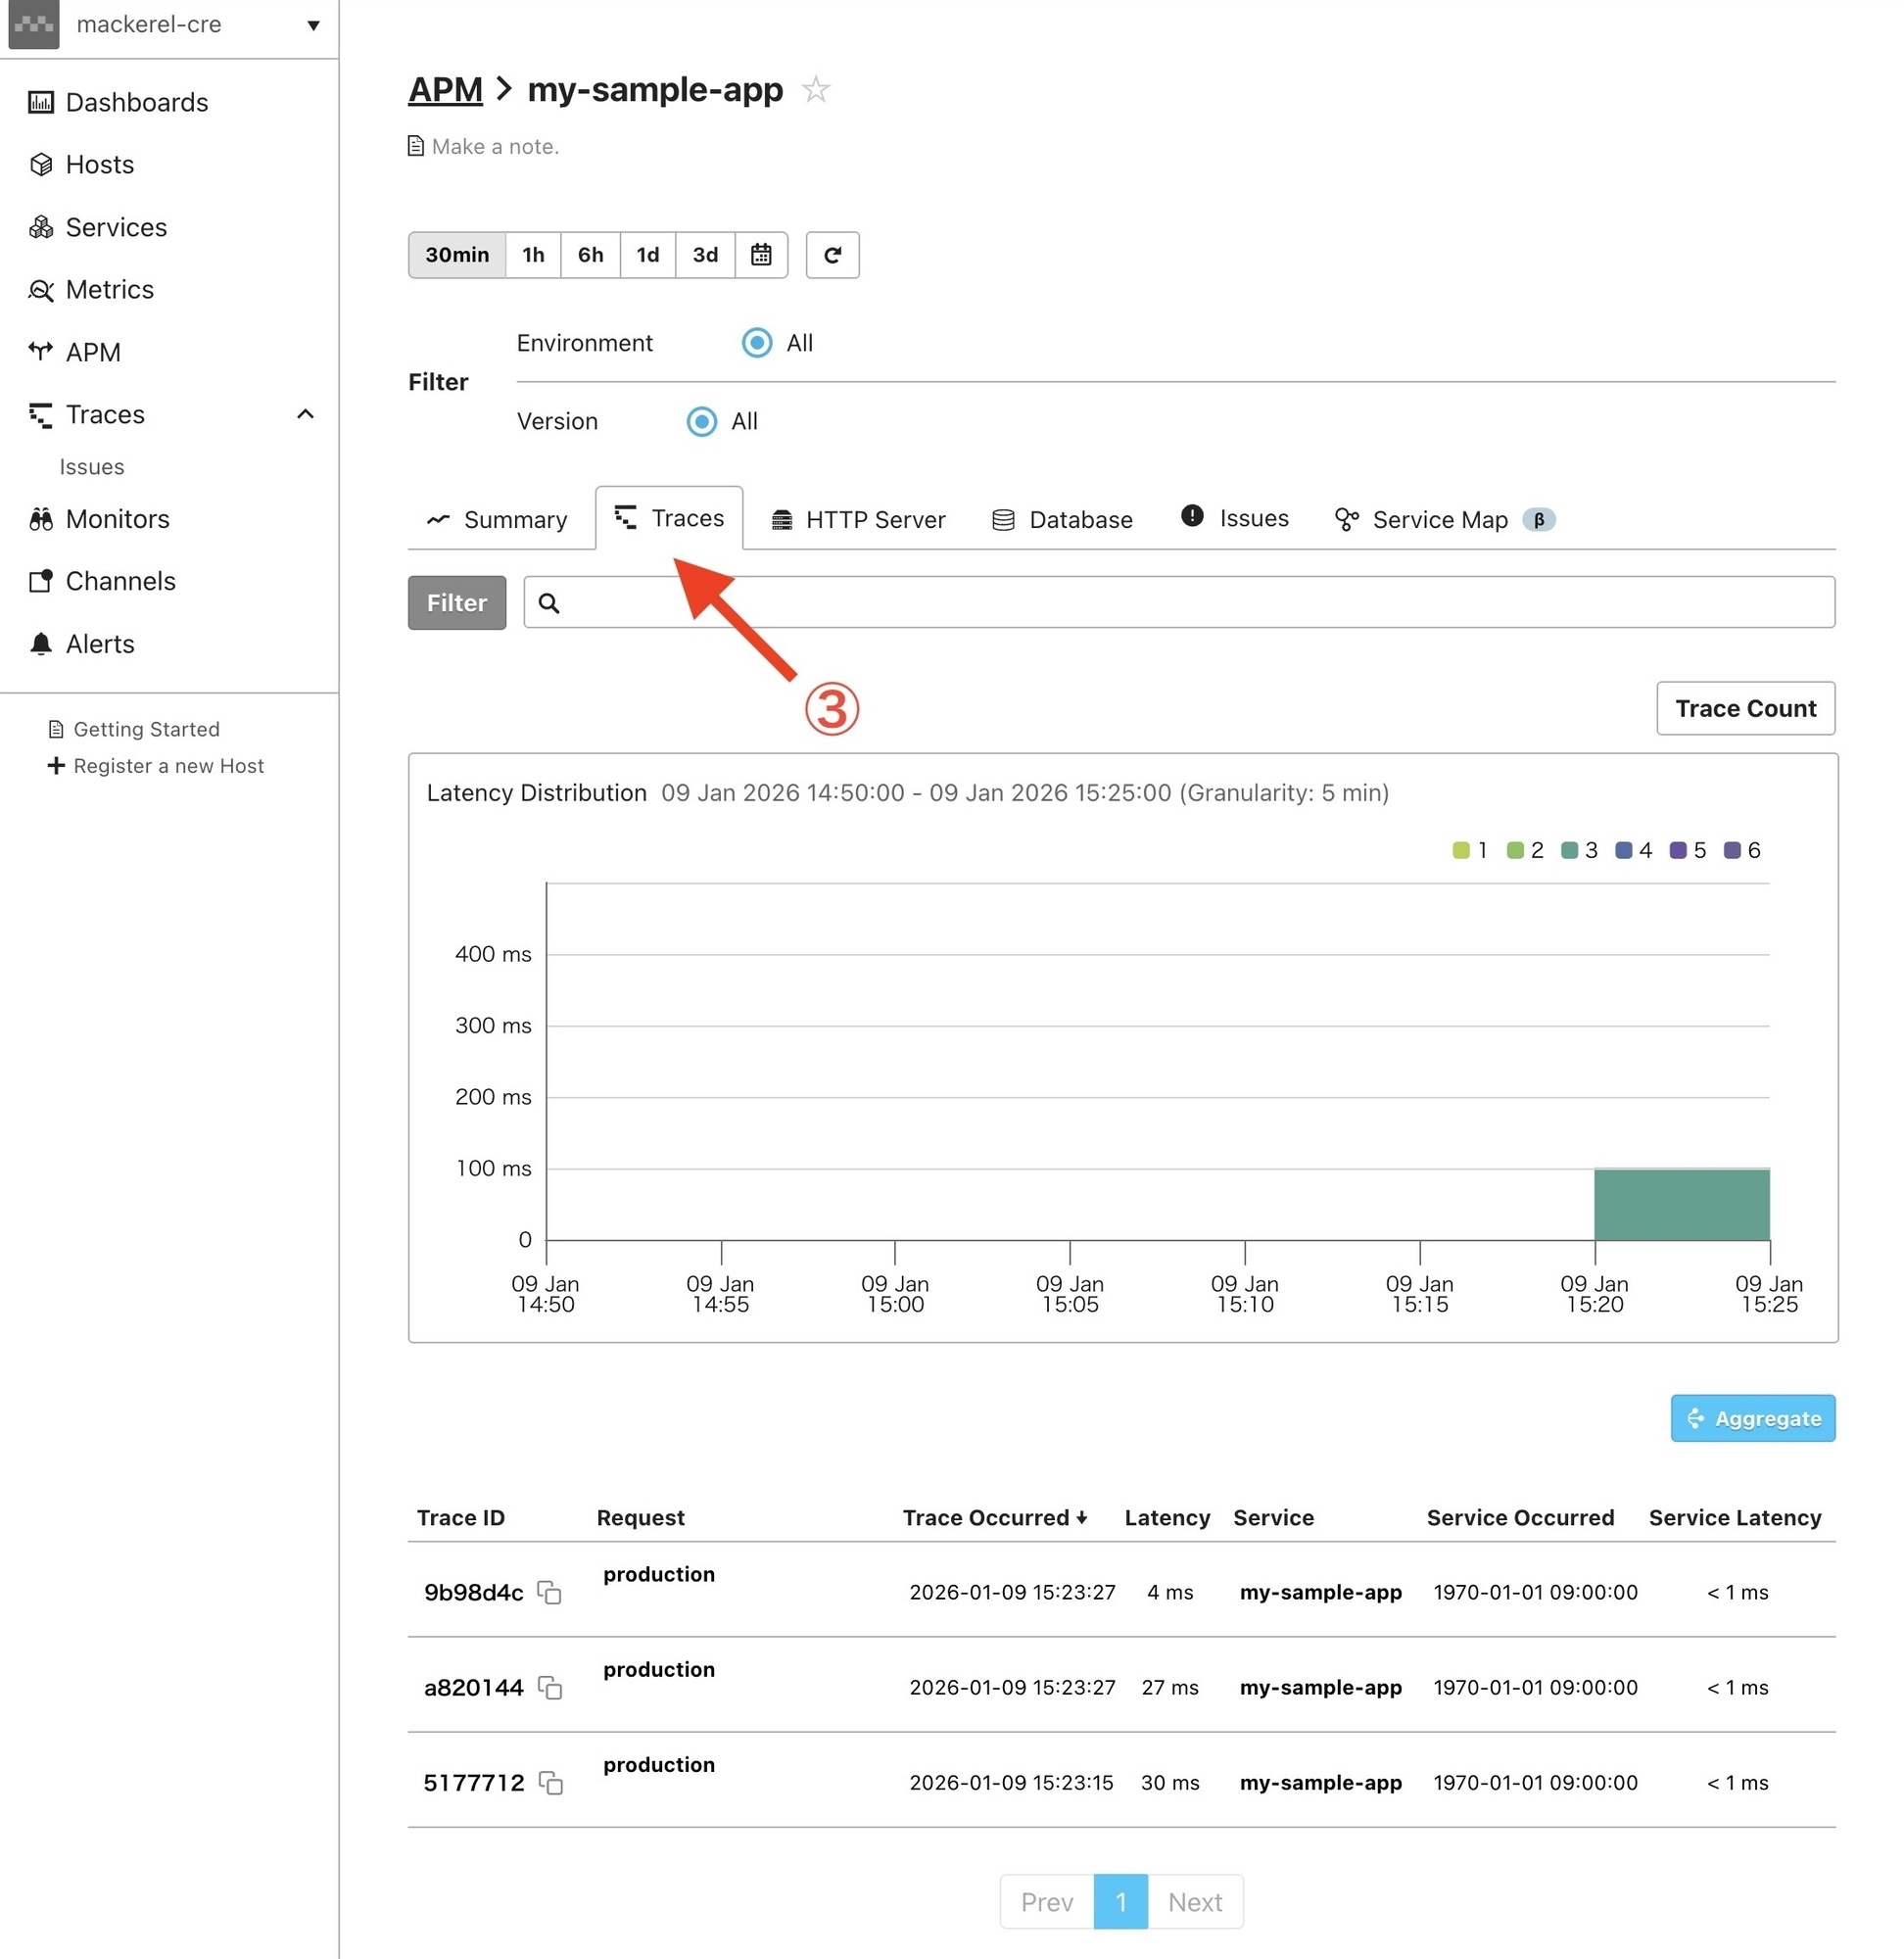
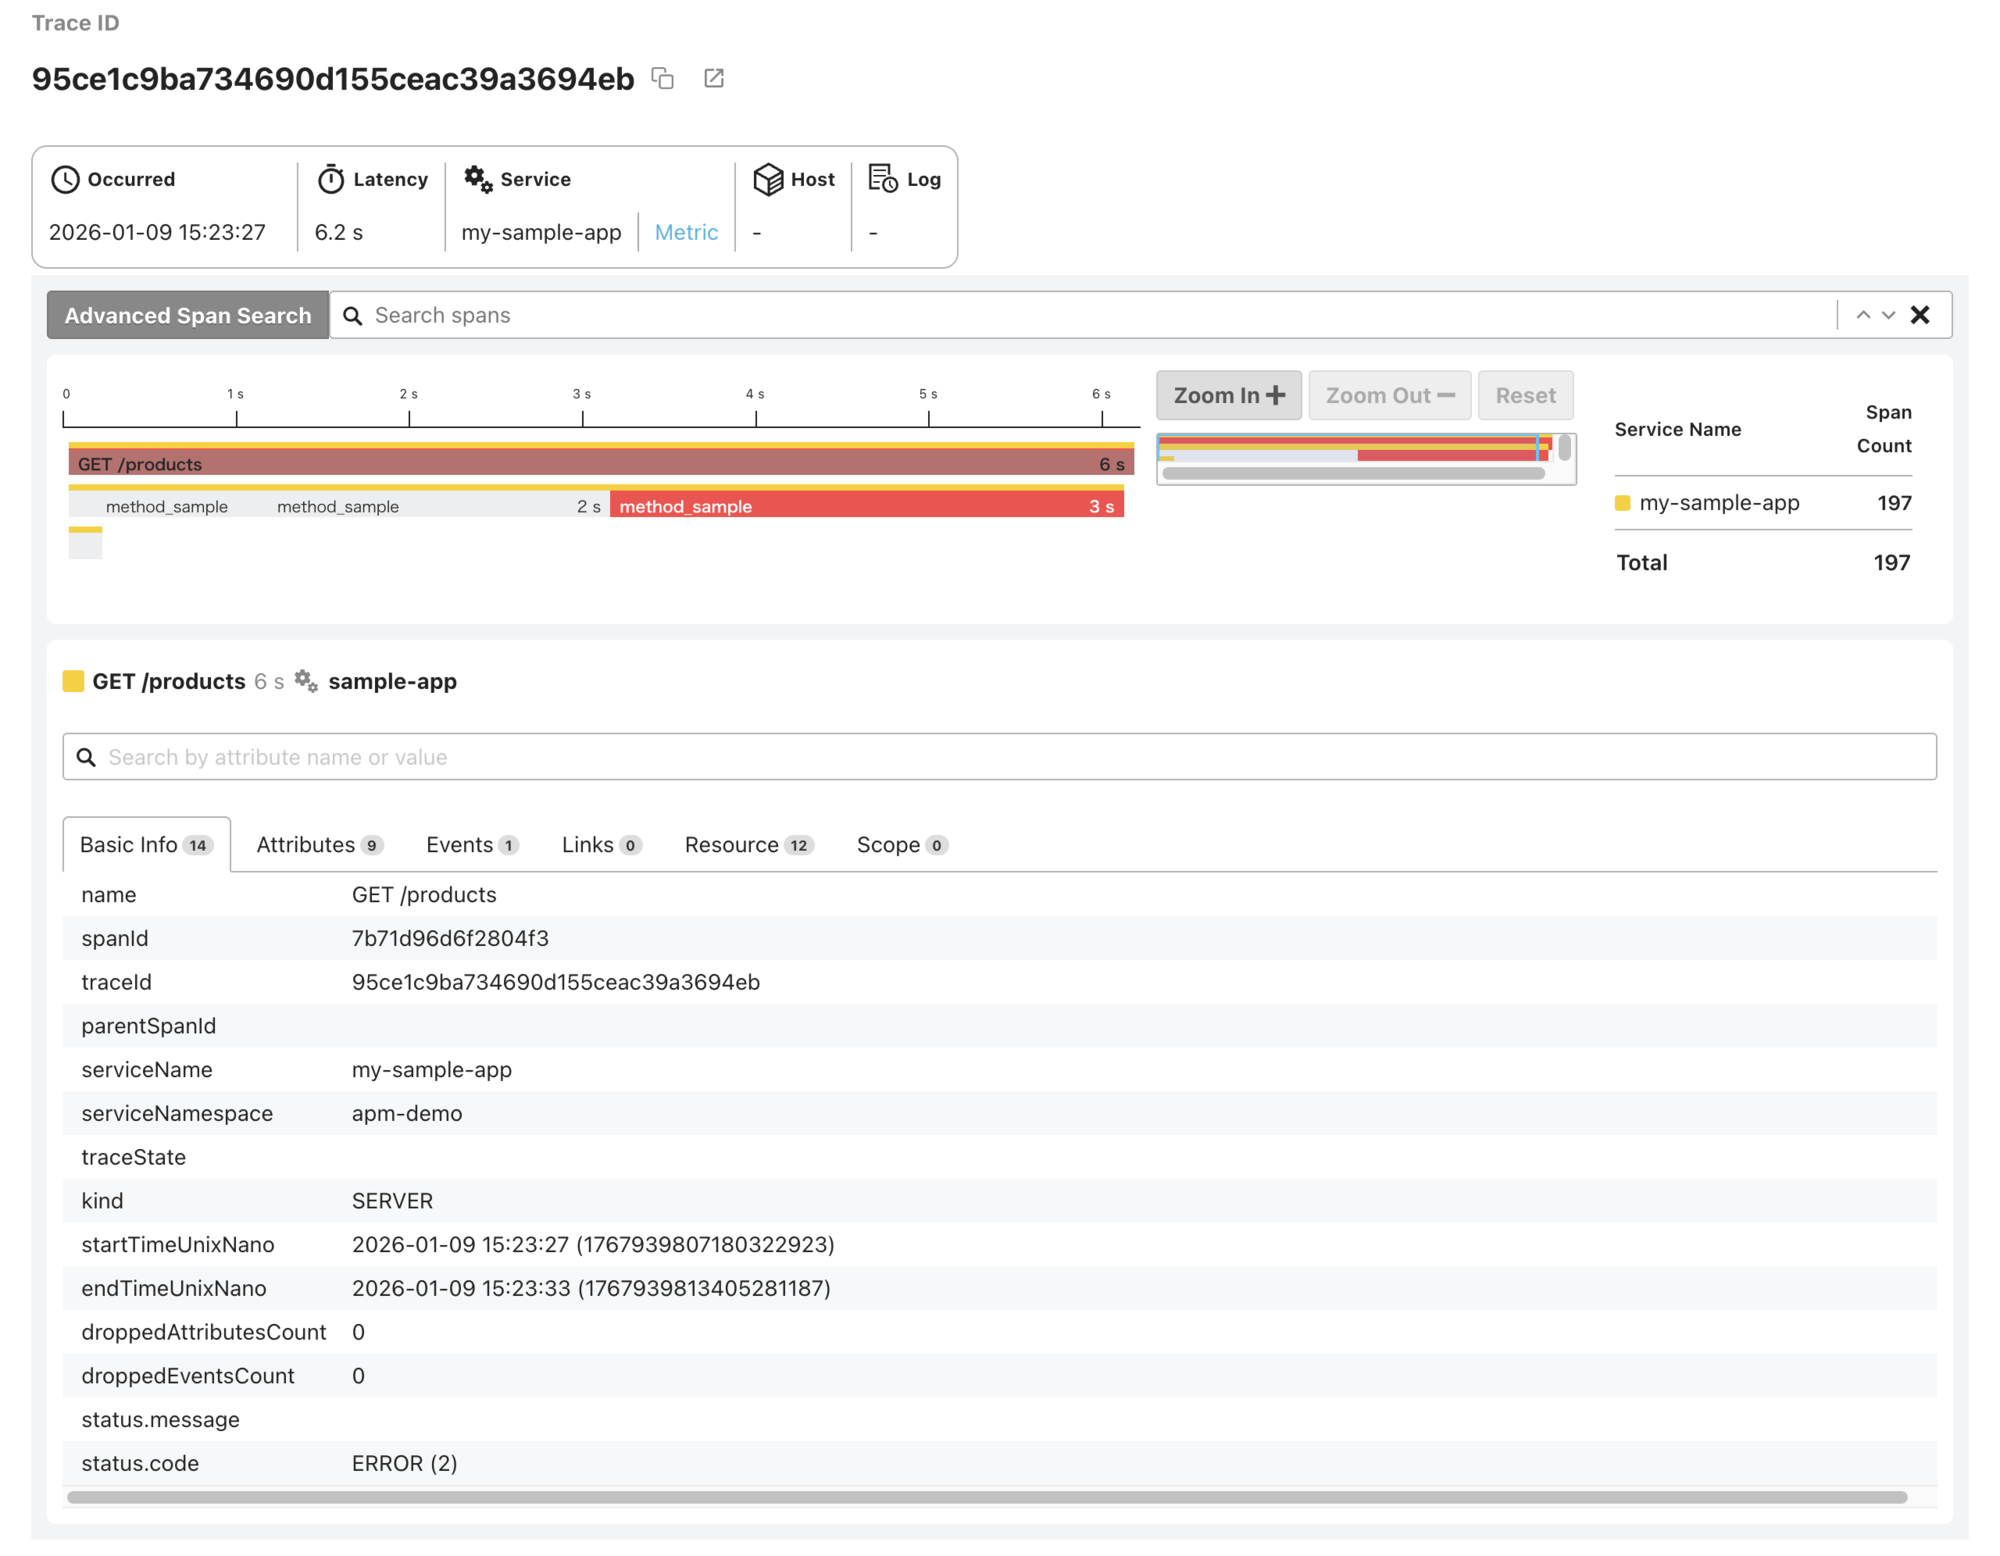
- Select a trace from the trace list to view its details
That’s a wrap on setting up zero-code instrumentation and sending traces of your Python applications to Mackerel.