Hello! This is Toya (![]() id:KGA) from the Mackerel CRE team. Here are the details on our latest update.
id:KGA) from the Mackerel CRE team. Here are the details on our latest update.
- Continuing to improve APM
- You can now filter by string in the HTTP Server and Database tabs.
- You can now export information from the HTTP Server and Database tabs in CSV, JSON, and other formats.
- An API for retrieving traces has been released.
- Notes can now be added to APM services.
- Summary graphs can now be displayed separately by environment or version.
- Suspended notification channels are now easier to notice.
- Check monitoring results on the host details screen are now easier to read.
- The mackerel-plugin-oracle plugin for retrieving Oracle Database metrics has been released on Mackerel Labs.
Continuing to improve APM
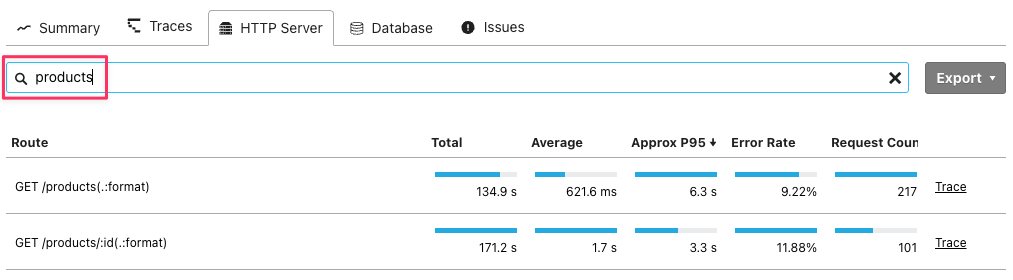
You can now filter by string in the HTTP Server and Database tabs.
You can now filter HTTP server and database traces by entering a string in the query input field. By filtering traces related to specific requests or database queries, you can check latency distribution and easily identify specific traces.
products
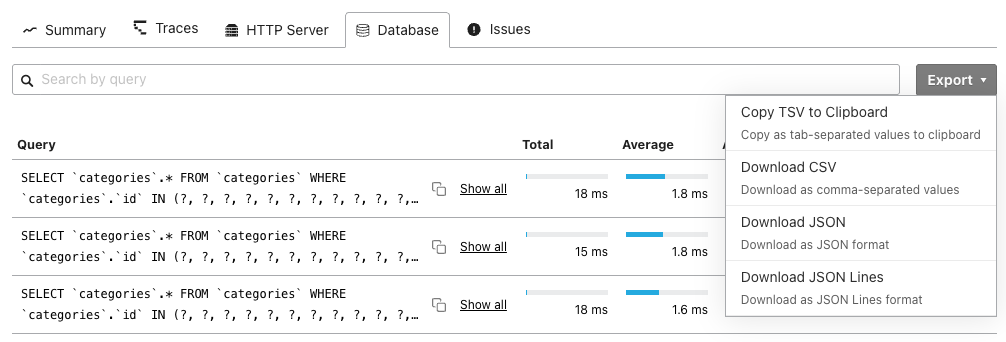
You can now export information from the HTTP Server and Database tabs in CSV, JSON, and other formats.
When the HTTP Server or Database tab is open, you can now use the "Export" button to export the trace information in the TSV, CSV, JSON, or JSONL formats. This makes it easier to analyze or share trace information with external tools.
An API for retrieving traces has been released.
We have released an API that allows you to retrieve trace information. You can retrieve APM trace information from programs and combine it with generative AI to analyze performance and errors. For details on the API, see the API documentation.
Notes can now be added to APM services.
You can now add notes to APM services. By providing a service overview or adding links to related documentation, the service becomes easier to understand. Notes can be added and edited from the APM screen.
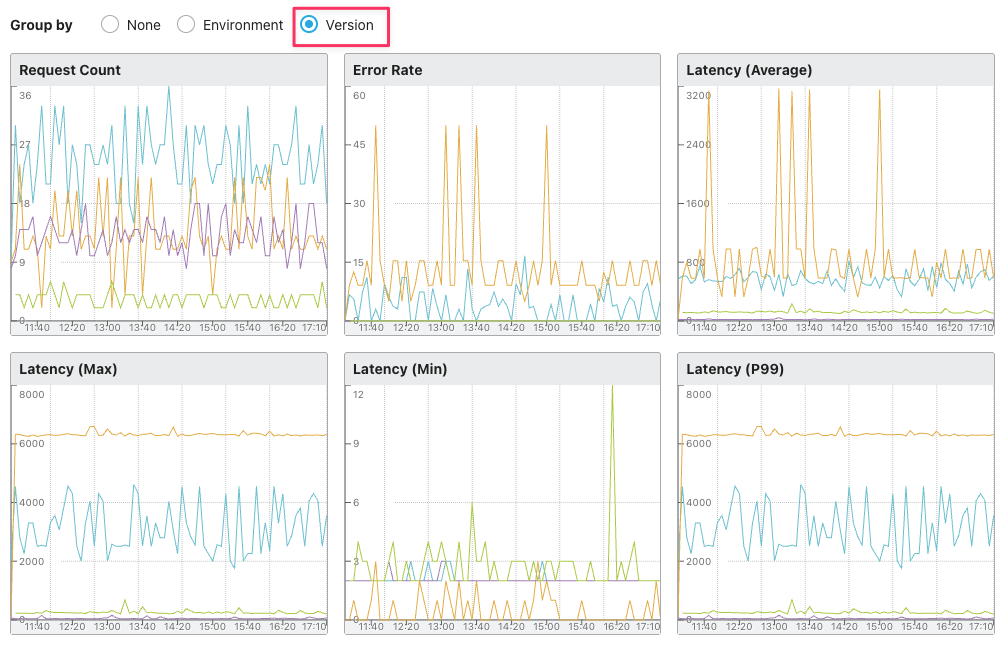
Summary graphs can now be displayed separately by environment or version.
Summary graphs can now be displayed separately by environment or version. This makes it easier to compare performance across different environments or versions. From the APM summary screen, you can select "Environment" or "Version" to view the graph.
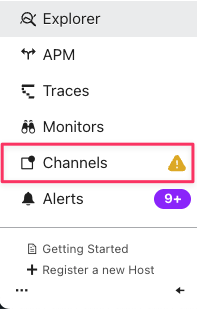
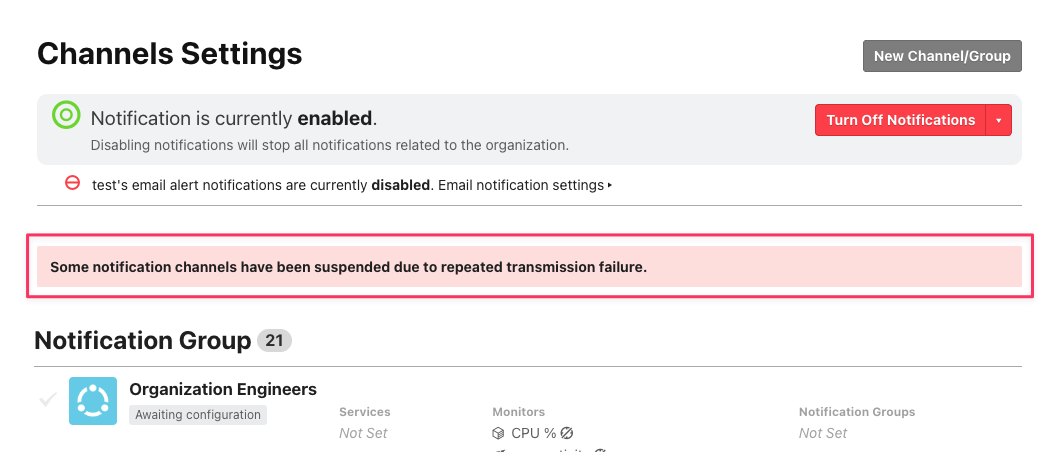
Suspended notification channels are now easier to notice.
Previously, if a notification channel was suspended, a message indicating the presence of a suspended notification channel was displayed on the organization dashboard. Now, a message is also displayed in the notification channel list, and an icon is also displayed in the side menu. This makes it easier to notice suspended notification channels.

Check monitoring results on the host details screen are now easier to read.
If the content output by the check plugin contains line breaks, the check monitoring results on the host details screen will now retain those line breaks.

The mackerel-plugin-oracle plugin for retrieving Oracle Database metrics has been released on Mackerel Labs.
We have released the mackerel-plugin-oracle plugin, which allows you to connect to Oracle Database and retrieve metrics.
This plugin was originally created by mattn. With their permission, the Mackerel team has made some modifications to it, allowing it to be used immediately without the need for manual builds. We would like to thank mattn for their kind permission.
To use it, please download the version that matches your architecture from the release page and set it up according to the README.
Please note that software released by Mackerel Labs is experimental and therefore not covered by support. Please note that we are generally unable to respond to inquiries. We thank you for your understanding.