Thank you for using Mackerel. We are pleased to announce the beta release of Mackerel's APM (Application Performance Monitoring)! In this article, we will introduce the experience you will receive with Mackerel with APM, as well as the pricing structure on official release.
APM is a tool that visualizes application performance and status, and assists in early problem detection and resolution. In addition to the infrastructure-centric system monitoring that Mackerel has provided up to this point, APM provides detailed unit-based tracking of system transactions, identifications of bottlenecks such as HTTP requests and database accesses, and other functions for monitoring applications and improving observability.
Contents
- Providing a service-centric observability experience
- APM will be officially released on May 1st! Pricing structure also unveiled
- A tutorial and a submission guide for utilizing APM are also available
- Continuing to evolve in preparation for the official release
- We welcome your thoughts and feedback after using APM
Providing a service-centric observability experience
Starting from the APM list of services, you will be able to view RED metrics (Number of responses, Errors, Durations), tracing, HTTP servers, and database performance, which are useful when verifying application health and performance. Combined with the tracing functionality we have been providing ahead of time, this will make it even easier to improve daily performance and identify failure causes, allowing you to quickly arrive at essential issues.
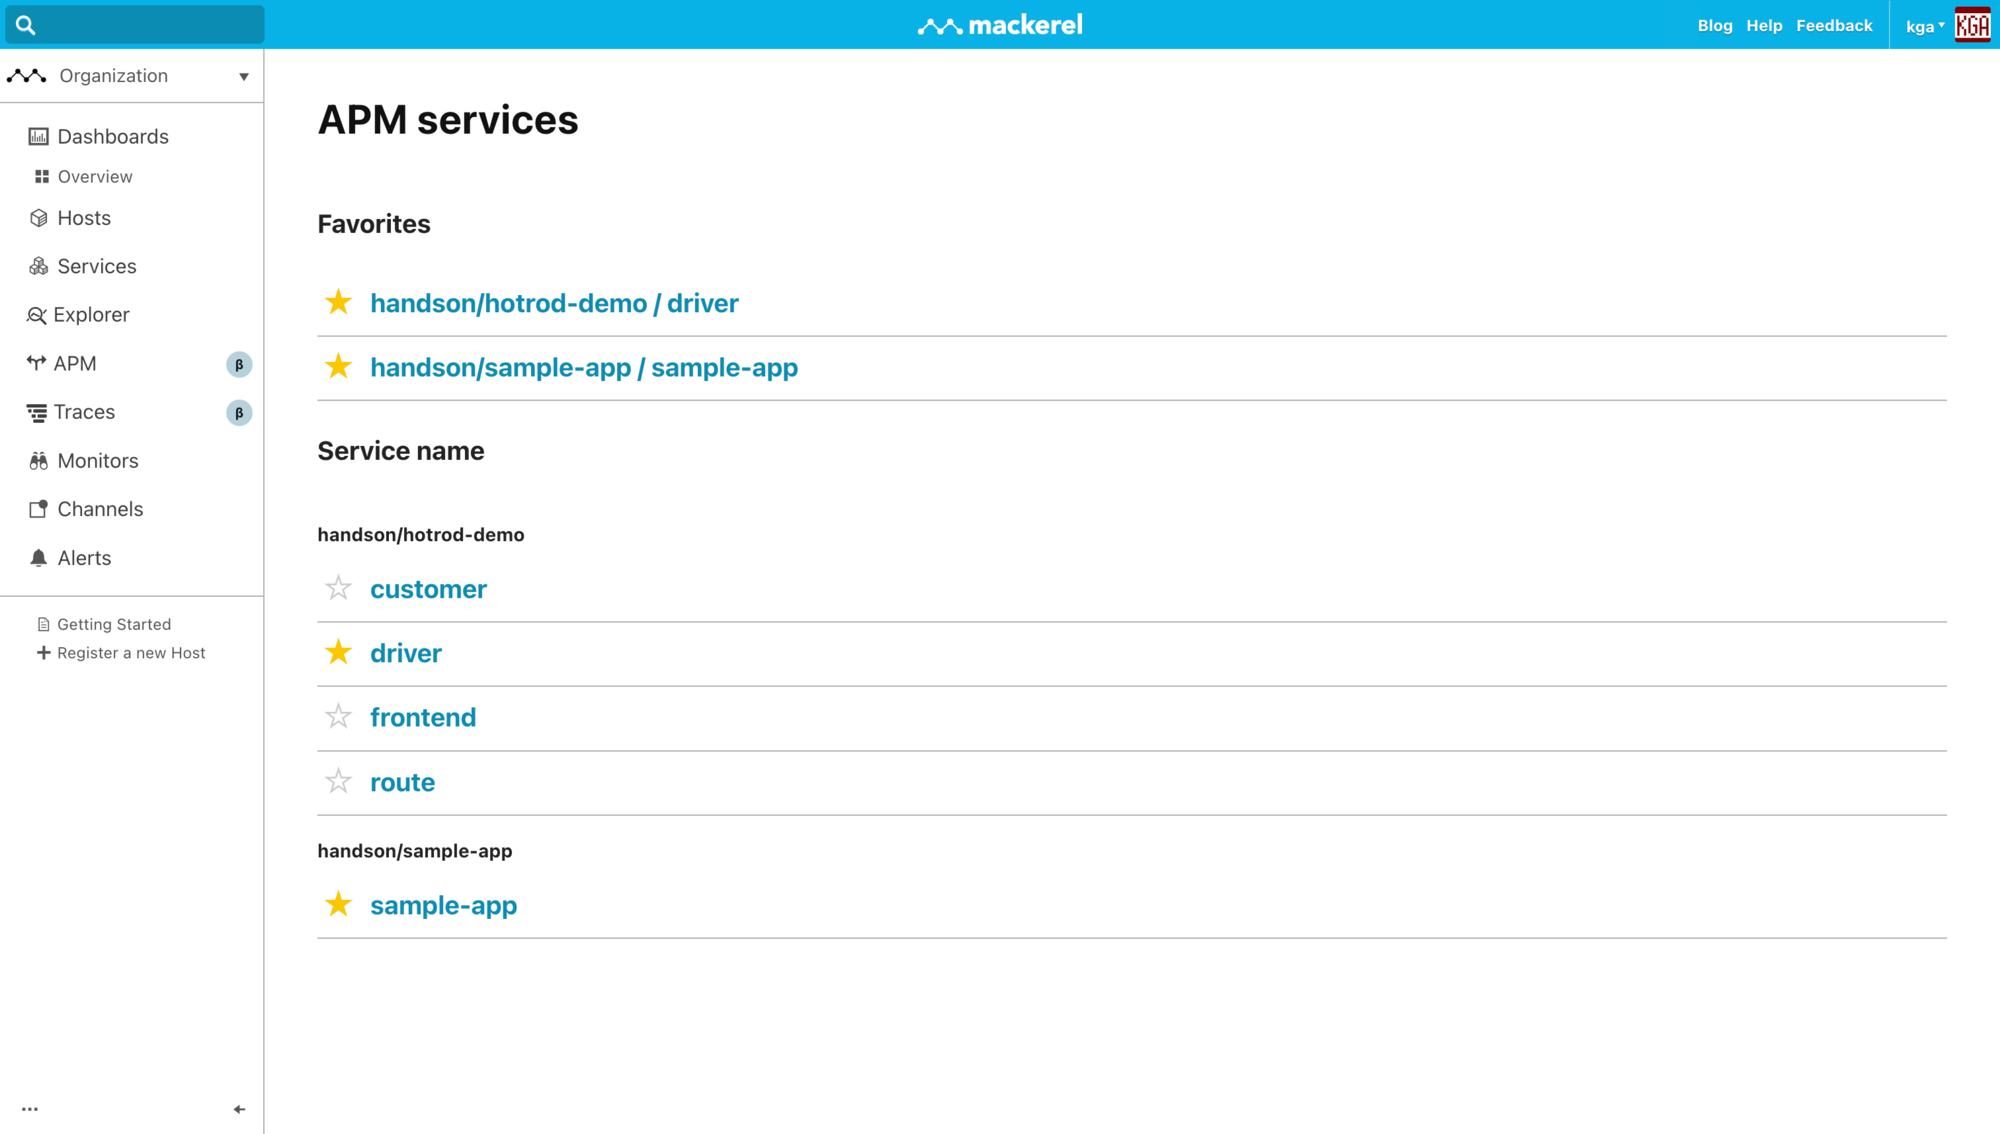
List of services as a starting point for detailed analysis
You can view the service (service.name) attributes that you have set to trace in this list. From this page, you will be redirected to a summary where you can check the performance of individual services.
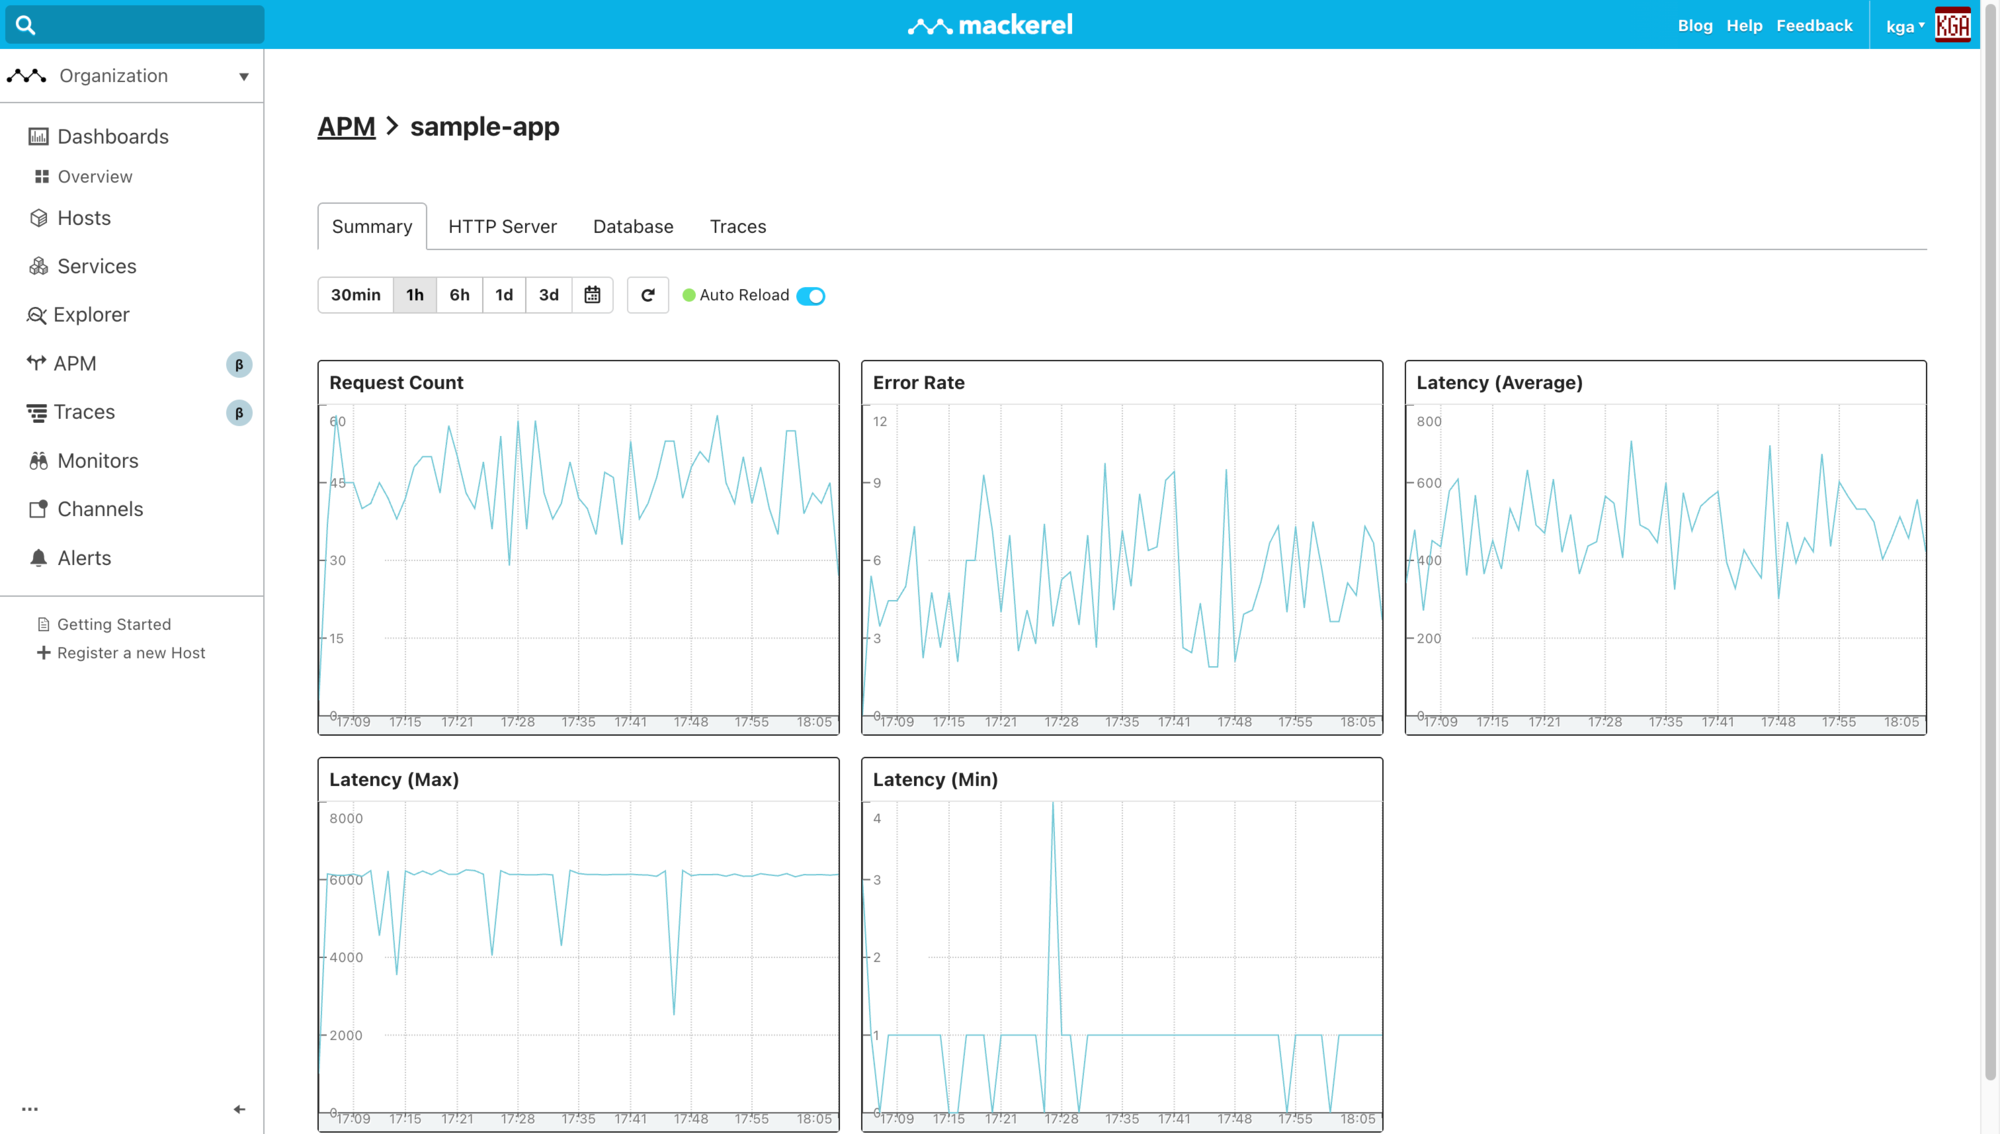
Summary allows you to quickly check the performance of individual services
Summary allows you to view the RED metrics (Number of responses, Errors, Durations) for a specific service. The Average Response Time graph helps you evaluate user experience and system performance, and the Number of Requests graph helps you evaluate application traffic and load trends.
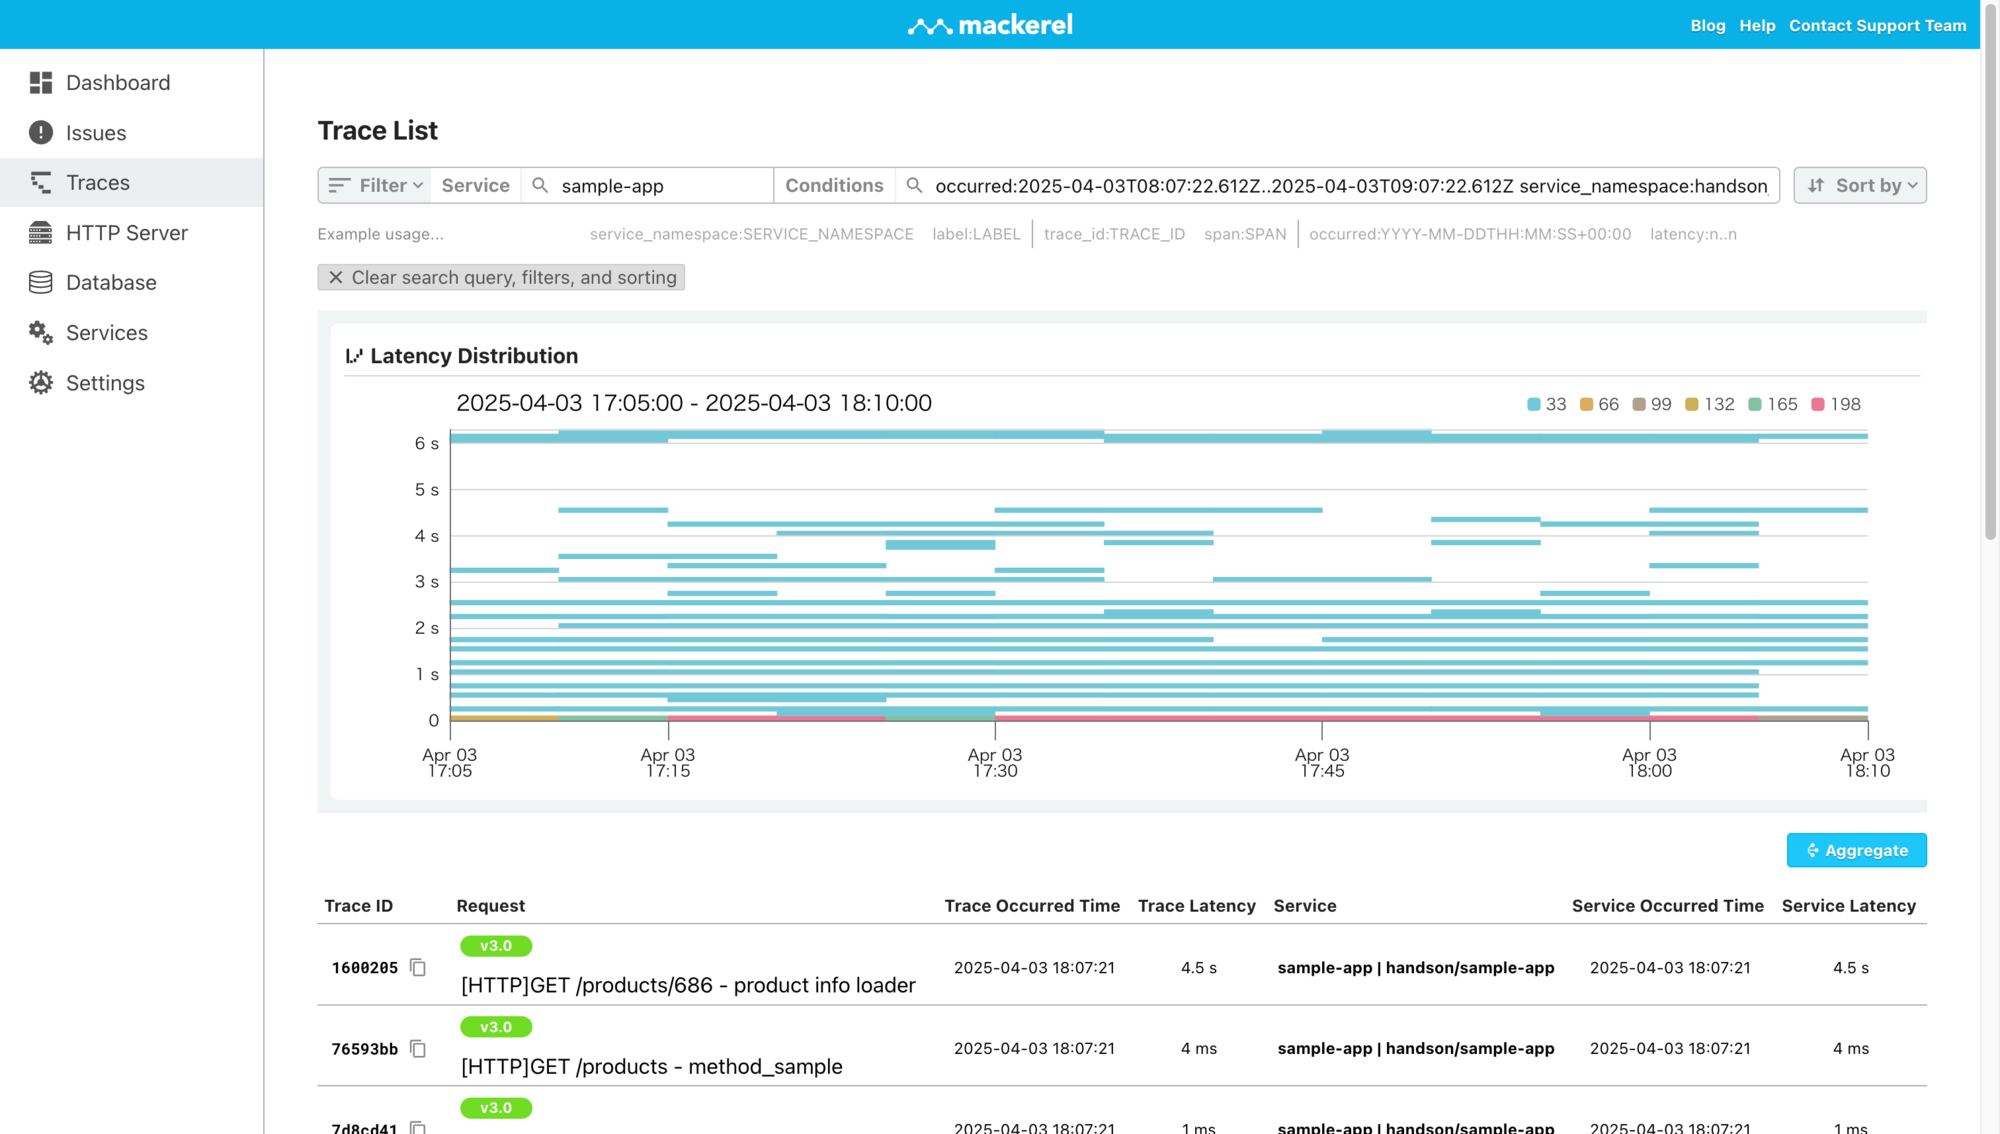
Trace, HTTP Server, and Database are useful for analyzing problems
The Trace, HTTP Server, and Database pages provide a list of individual items associated with a service. After identifying trends in the Summary tab, you can easily search for the cause of performance degradation or failure.
In the Trace page, you can intuitively understand performance statuses by viewing latency distribution histograms, as well as narrow down traces (environment, span name) and sort them by latency.
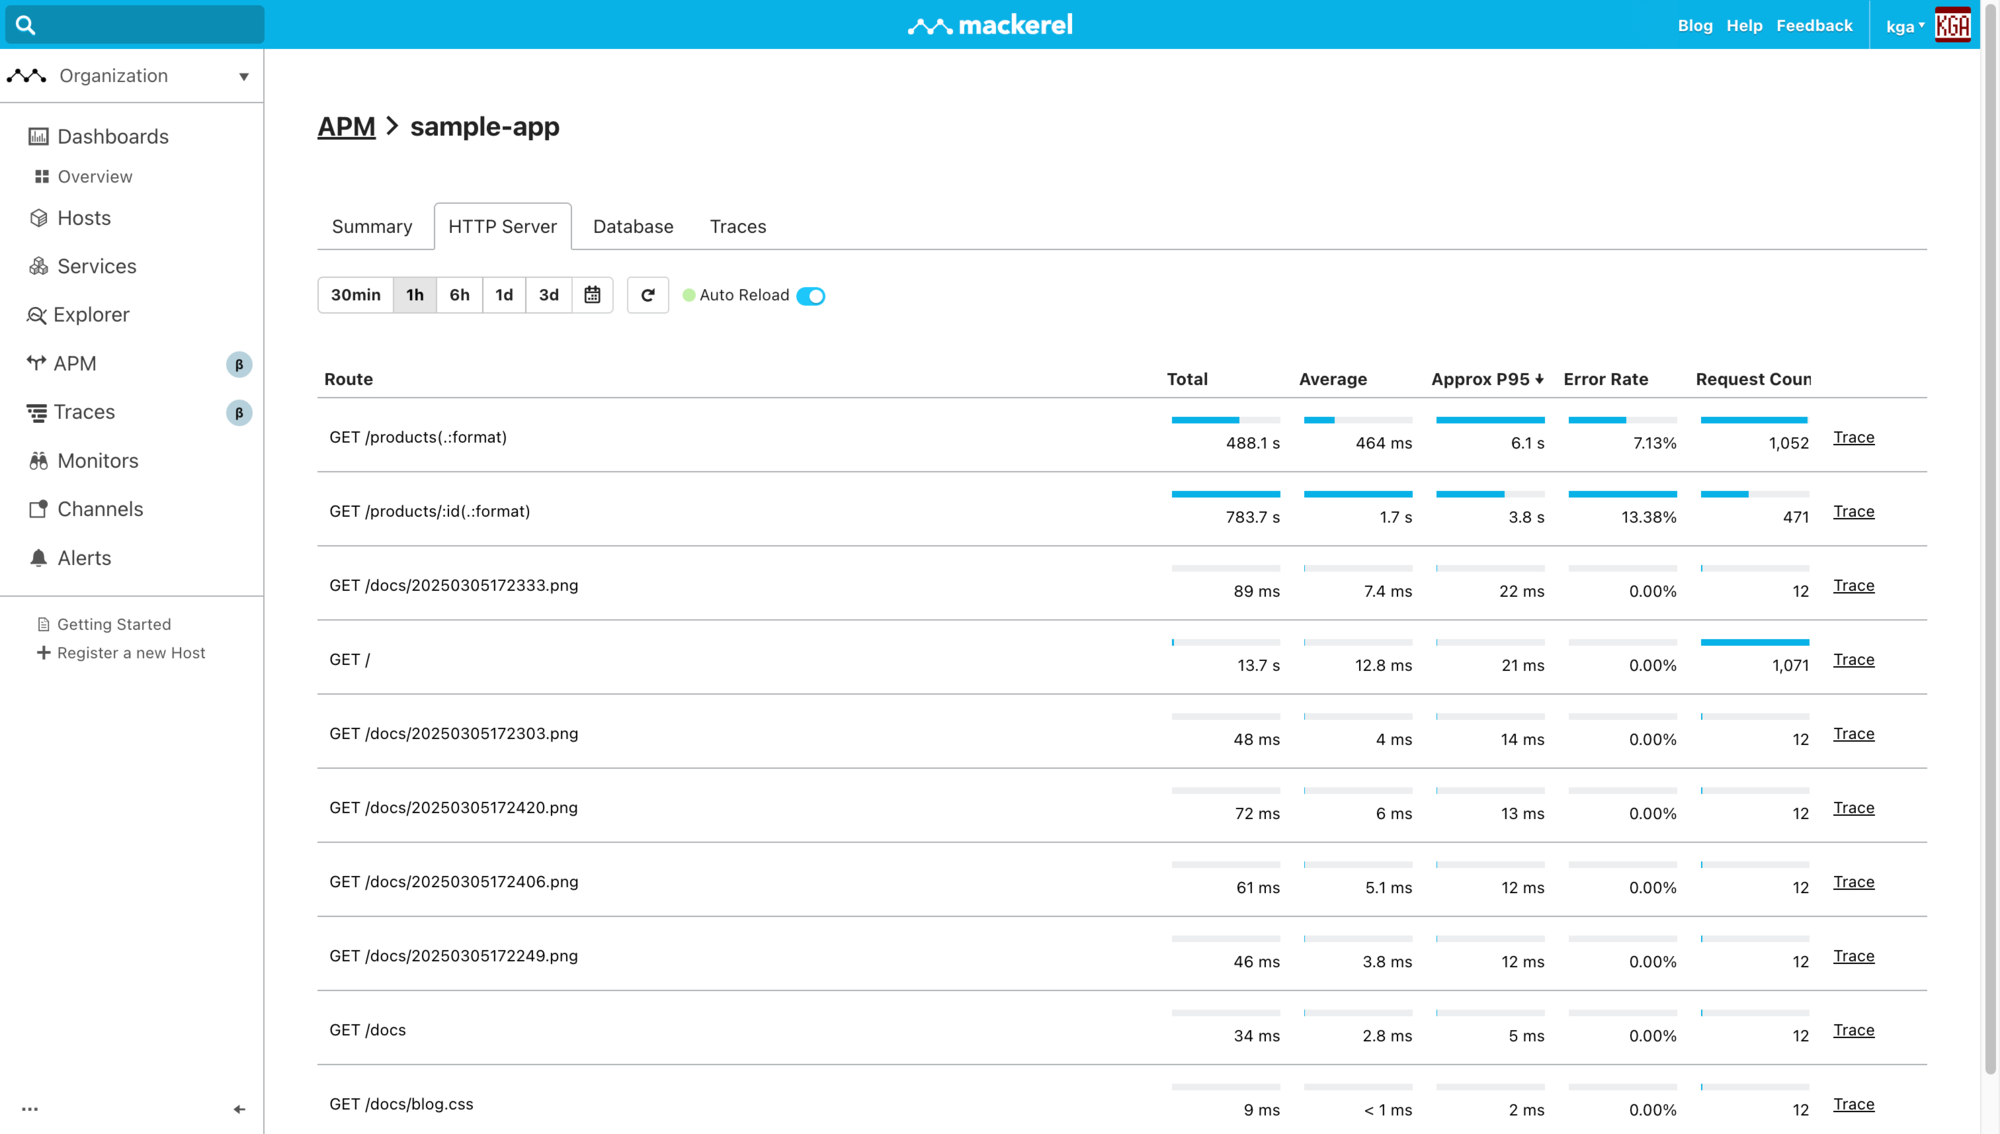
HTTP Server is a report card for each endpoint of a web application. It lists total and average response times, 95th percentile values, error rates, and number of accesses. The response times and error rates allow you to see at a glance which endpoints are impairing the user experience, and points you directly to the request trace so that you can quickly investigate the cause of the problem.
The Database page lists the total and average execution times and number of executions for database queries. You can easily identify queries that are causing performance degradation. You can also go directly to a trace from this page.
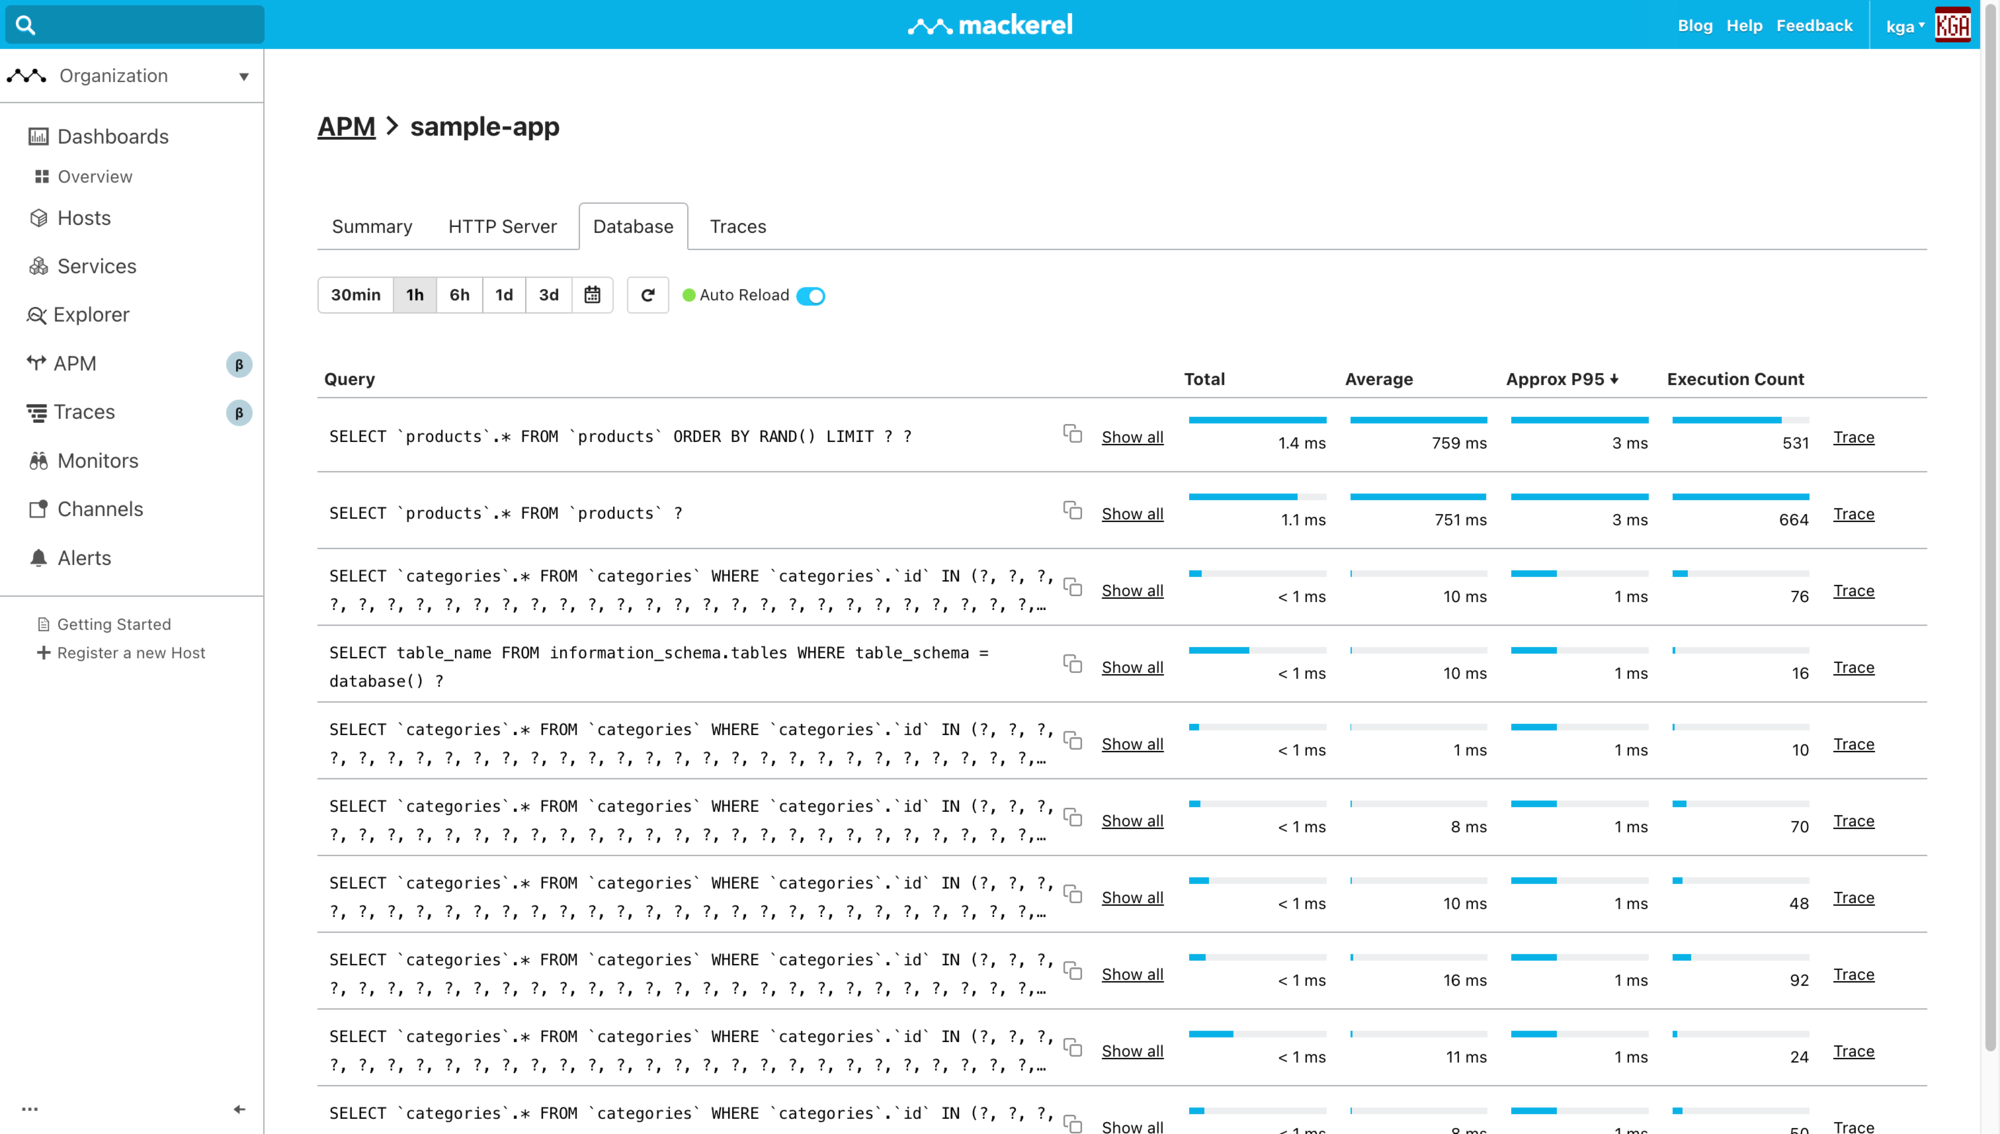
These summaries and lists are compiled and displayed based on spans of HTTP requests and database queries that are being traced. Spans are the individual processing units that make up a trace. For example, specific function calls, database queries, or requests to external APIs are recorded as spans. For details on which spans are included in these summaries and lists, please refer to the help page.
- トレース - HTTPサーバーのパフォーマンスを調査する - Mackerel ヘルプ (in Japanese)
- トレース - データベースのパフォーマンスを調査する - Mackerel ヘルプ (in Japanese)
APM will be officially released on May 1st! Pricing structure also unveiled
The official release of APM is scheduled for May 1st, 2025.
In addition to the existing standard host, microhost, and metric pricing, there will be a per-span fee linked to submitted traces. The pricing structure is planned to be as follows.
APM's functions are built on the spans that make up a trace. Therefore, the number of spans will be the billing unit.
| Plan | Free | Standard |
|---|---|---|
| Span submission limit | 5m spans/month | Unlimited |
| Price (excluding tax) | ¥0 | Free up to 5m spans/month ¥300 for every 1m spans thereafter |
- The billing month is determined by the time a span is received.
- The number of spans is rounded up and totaled, and the price is calculated.
- There will be a minimum usage fee 1 applied to the billing amount that includes the number of hosts, the number of metrics, etc.
- You can submit up to 5m spans/month for free during the beta period. If you exceed that amount for a certain organization, you will not be able to submit spans to that organization until the following month.
- Traces and spans submitted during the beta period will be stored for 3 days, and will be stored for 14 days after the official release.
The formula for calculating the price is as follows.

Here are some examples of price calculations.
- less than 5m spans: Free, since 5m spans is within the free quota.
- 6m spans: The price is ¥300+tax since 6m spans exceeds the free quota by 1m spans.
- 7.5m spans: 7.5m spans exceeds the free quota by 2.5m spans, and the price is rounded up to the nearest ¥300 per 1m spans, so the price is ¥900 (3×¥300)+tax.
A tutorial and a submission guide for utilizing APM are also available
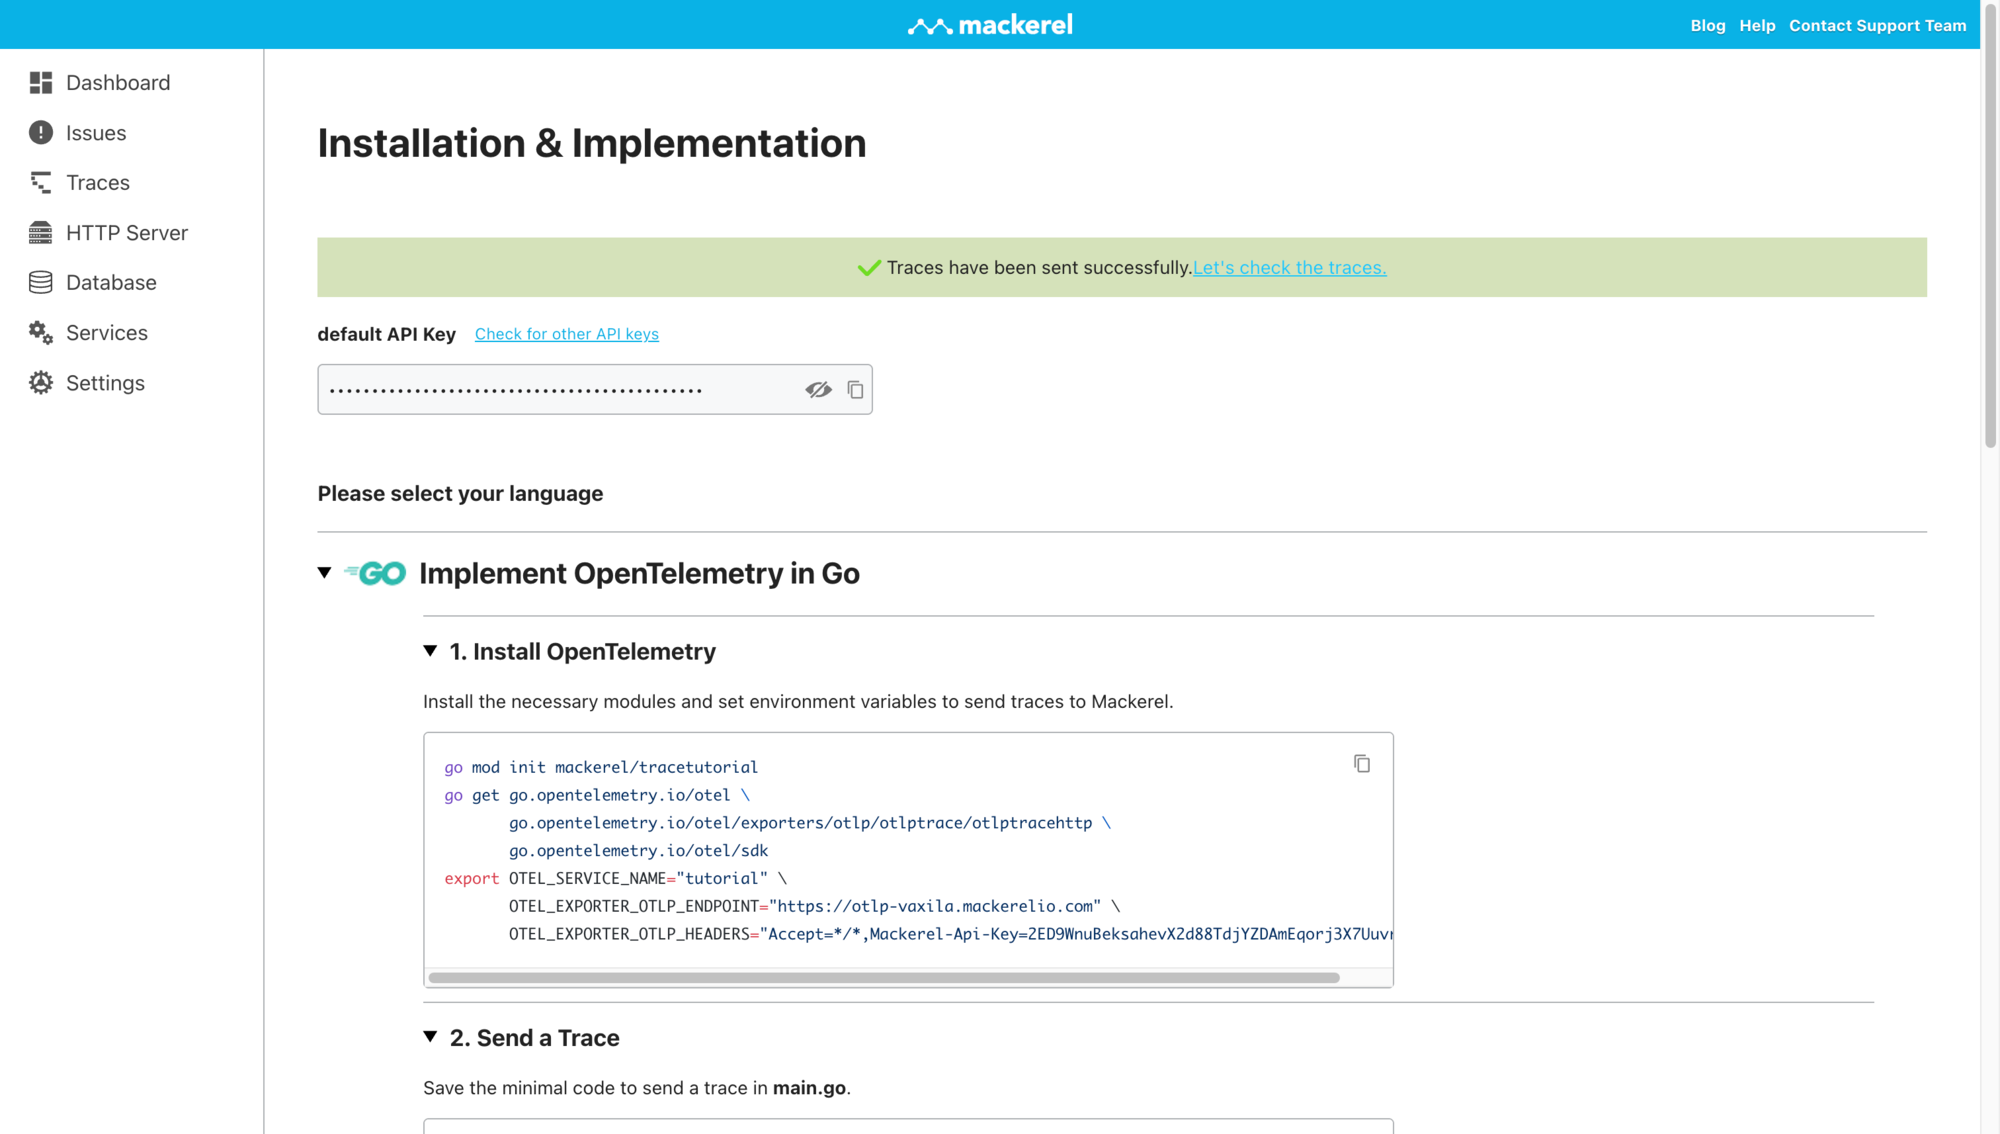
The performance summary that can be viewed in APM is compiled based on trace data. We have a tutorial page and a guide page to help you more easily submit traces.
The tutorial provides sample code in a variety of programming languages. You can submit traces with just a few simple lines of code, so please try it out.
The tracing feature guide contains more detailed explanations of settings for each language, as well as explanations of each function.
- トレース - Mackerel トレーシング機能ガイド - Mackerel ヘルプ (in Japanese)
For a more practical example, we have also published hands-on documentation that will help you better understand distributed tracing and tracing functions. Please take a look at the documentation in the correct order to learn the basic concepts of distributed tracing and OpenTelemetry, as well as how to use the trace submission and tracing functions.
- 【資料公開中!】わかった気になる分散トレーシング - OpenTelemetryでトレーシングに入門するハンズオン!を開催しました! - Mackerel ブログ #mackerelio (in Japanese)
Continuing to evolve in preparation for the official release
The official release will further integrate Mackerel's existing functions with APM, making it more convenient and intuitive to use. We will be unveiling just a few of the screen designs that we are currently considering, so please look forward to it!

We welcome your thoughts and feedback after using APM
The Mackerel development team is adding features and making improvements to APM in preparation for its official release. Please let us know your thoughts on this article and your feedback after using Mackerel's APM during the beta period! Please feel free to contact us for technical assistance with APM implementation or to request a demo or hands-on session.