Mackerel team CRE Yoshida (![]() id:syou6162) here. And today I’d like to highlight 3 Mackerel features that really come in handy when working remotely.
id:syou6162) here. And today I’d like to highlight 3 Mackerel features that really come in handy when working remotely.
Sharing graphs with team members by posting to Slack
When working / developing with a team while physically together in the same room, it’s probably most common to have the Mackerel dashboard displayed on a large screen for everyone to see (like in the WILLER case study). If everyone’s looking at the same screen, the discussion can progress. However, this approach might need to change when the situation calls for working remotely through applications such as Google Meet or Zoom, and depending on certain variables like connection status and bandwidth, sharing the same screen with every member may not be an option.
For situations such as this, we definitely recommend using the graph sharing function. You can easily post graphs to notification channels by simply clicking the camera button on the graph screen.

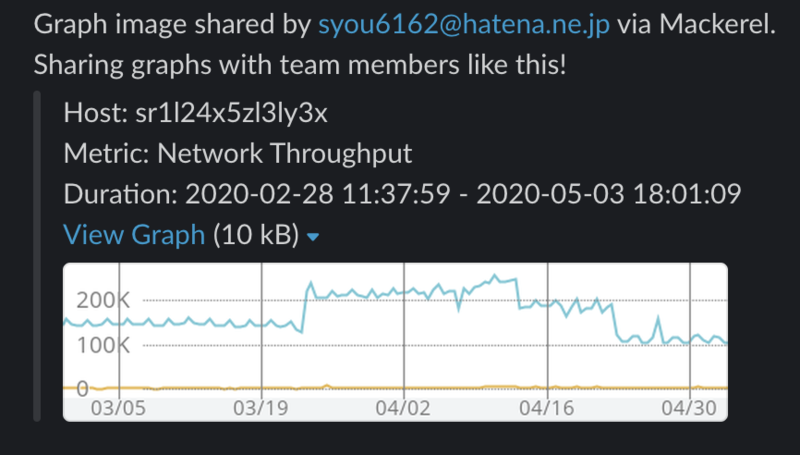
This function lets you share a graph that you are currently viewing in Mackerel with notification channels. With just a few clicks, you can share any graph that you might want to discuss with team members without having to share the screen itself. We believe that this can be really useful and hope that you put it to good use while working remotely.
Graph Annotations
When working from home, I personally find it more difficult for communication to go smoothly compared to working face to face. And if the situation necessitates more communication, a higher chat flow is often inevitable. I’m sure many of us who regularly post notifications about server operations in congested chats can understand, keeping track of what happened throughout the day can be a struggle.
For this, Mackerel’s graph annotation function can be really useful. Graph annotations allow you to write and leave information for services and roles like details of when certain operations were performed.

Leaving graph annotations makes it easier to track the changes made to the service. We highly recommend adding a link to the pull request or a Git commit hash in the description as this will make it much easier to understand the situation. Also, being able to see the metrics and the annotation together is really helpful in understanding what caused the change.
Additionally, you can implement this for all kinds of things depending on the situation. Fellow CRE ![]() id:a-know wrote a blog post about leaving output lines detected by log monitoring as graph annotations. Check that out in the link below.
id:a-know wrote a blog post about leaving output lines detected by log monitoring as graph annotations. Check that out in the link below.
(Japanese only)
You can also post annotations using the mkr command, which is Mackerel's official CLI tool, or with the API. On top of that, you can have annotations posted automatically when the release is completed by incorporating these in the CI/CD tool application release flow.
When it comes to server operations, you might have more to think about when working remotely compared to in the office, but we hope that using graph annotations can help lighten that load a little.
An easy to read user interface even from your smartphone
One of the obvious perks of working from home is not having to commute. But for some, that time is used to mentally switch on/off from work. I can sympathize. After work, I want to close my PC and just relax, but more often than not, an alert or a problem will pop up and drag me right back. Even if I tell myself I’m just checking an alert, if I reopen my PC, it’s easy to inadvertently get sucked back in.
Mackerel’s user interface was designed to be user friendly and easy to read on PC, but the same goes for smartphones as well. The graph sharing function, which we covered in the beginning, can easily be utilized from your smartphone and checking alerts is quick and easy. If it’s not a problem that needs to be dealt with right away, you can just stay lying down and relax. Being able to use Mackerel from your phone while relaxing might help relieve some stress.
Bonus: Monitor your own room environment with service metrics
When stuck at home all day, sometimes it’s easy to get caught up in work and forget about important things like ventilation. If the CO2 level gets too high and your head starts feeling a bit foggy, that’s a situation we definitely want to avoid.
Some users monitor the carbon dioxide and humidity levels in their rooms using IoT devices with Mackerel service metrics. It's relatively easy to install, so if you're interested, why not give it a try?
(Japanese only)
To close
For many of us, remote work is becoming the norm and there’s going to be a lot that needs to change. But with the help of Mackerel’s intuitive functions, I think that service monitoring can still run smoothly even while working remotely. If you’ve been meaning to try any of these functions out but haven’t had the chance, by all means, now is as good of a time as any.