
Hello, this is Mackerel CRE's ![]() id:kmuto. Golden Week is finally here in Japan starting next week—have you made preparations for monitoring and observing your services? Let’s take a look at what’s included in this update.
id:kmuto. Golden Week is finally here in Japan starting next week—have you made preparations for monitoring and observing your services? Let’s take a look at what’s included in this update.
- External URL Monitoring Now Supports IPv6
- In the service metrics graph for external URL monitoring, failed value retrievals are now displayed as "gaps"
- Checks for Cookies, TLS, and Certificates in External URL Monitoring Have Been Tightened
- Custom metric units are now displayed on the role graph list screen
- Services for notifications can now be selected in the "Issues" section of APM
- In Metric Explorer, the "Difference" view now persists even when you apply filter conditions to a graph
- Notice: The appearance of alert Slack notifications will be changing
- The expiration time set in SessionNotOnOrAfter now be used as the expiration time for login sessions using SAML authentication
- The "--quiet" option is introduced to the mkr command to suppress info-level log output
- Fixed the display of event IDs in the output messages of the check-windows-eventlog plugin
- Notice: Supported Versions for the MongoDB Metric Plugin will be Changed
- Notice of Support Desk Closure during the Golden Week
External URL Monitoring Now Supports IPv6
As we announced last month in this post, Mackerel's External URL monitoring now supports IPv6.
You can select the version you want to use under "IP Version" at the bottom of the External URL monitoring settings screen.

- IPv4 (Default): Sends requests using IPv4. If the destination cannot be reached via IPv4, it will not retry using IPv6.
- IPv6: Sends requests using IPv6. If the destination cannot be reached via IPv6, it will not retry using IPv4.
- Auto: Sends requests using IPv6, and if the destination cannot be reached via IPv6, it will retry using IPv4.
The default is "IPv4," and this setting is applied to existing external URL monitoring as well. If you wish to use IPv6, please select "IPv6" or "Auto."
Note that IPv6 external URL monitoring is performed from the following IP address ranges (this information is also available in JSON. Mackerel Metadata API).
2406:da14:f83:2600::/56
Additionally, as we mentioned in our recent announcement, we plan to enable IPv6 support for the Web Console and API endpoints on May 21, 2026.
In the service metrics graph for external URL monitoring, failed value retrievals are now displayed as "gaps"
In Mackerel's external URL monitoring, the response time from the target endpoint can be displayed as a service metric in a graph titled "HTTP Response Time" (*Billed per metric).
Previously, when external URL monitoring failed to retrieve a value due to an endpoint timeout or other reasons, that period was skipped, and the preceding and following values were connected by a line. However, this representation made it difficult to determine from the graph "when and for how long the issue occurred?"
With this update, periods during which external URL monitoring fails to retrieve values will be displayed as "gaps" on the graph. This allows you to quickly and visually identify the duration of the outage.
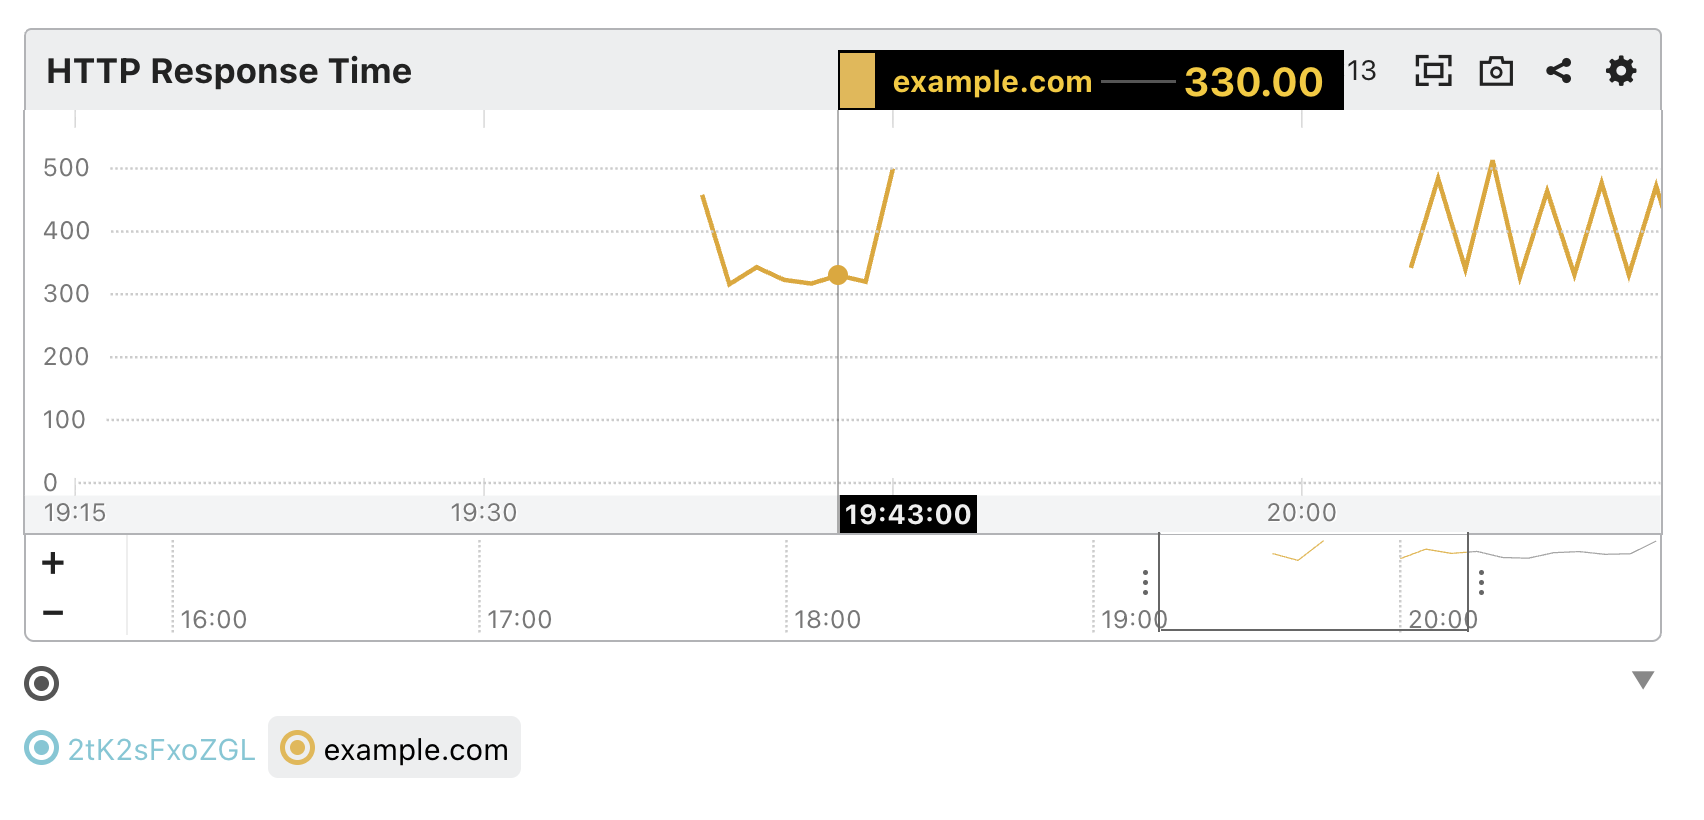
Please note that due to this change, when retrieving the relevant metrics via the API, NULL values will now be returned for periods where retrieval failed. Please be aware of this if you are retrieving metrics for analysis or other purposes.
Checks for Cookies, TLS, and Certificates in External URL Monitoring Have Been Tightened
Following a library update, the checking criteria for external URL monitoring have been tightened. As a result, some error messages have changed, so alerts caused by certificates that were previously detected but remain unresolved may be triggered again.
The main points of these stricter standards are summarized below. These changes address settings that are generally considered deprecated or vulnerable. If an alert is triggered, we recommend verifying the settings of the affected site and taking appropriate action.
- The criteria for setting and referencing cookies will now be based on the
Hostheader in the request. This may affect scenarios where Mackerel's external URL monitoring uses both redirects and cookies. - The SHA-1 signature algorithm has been prohibited in the TLS 1.2 handshake.
- The system has been tightened to reject behavior that deviates from the TLS specification.
- Certificates with a negative
pathLenConstraintwill be rejected. - The interpretation of the
ASN.1 T61StringandBMPStringfields in certificates has been tightened.
Custom metric units are now displayed on the role graph list screen
In Mackerel graphs, hovering over a data point displays the unit (such as KB or s for seconds), but until now, units were not displayed for custom metrics on the role graph list in the service details screen.
With this release, custom metric units are now displayed on the role graph list as well.

Services for notifications can now be selected in the "Issues" section of APM
Mackerel APM aggregates issues such as application exception errors detected from span information within traces, and you can receive notifications about these in Slack.

In response to user feedback requesting the ability to customize notifications when operating multiple application services, we have now made it possible to select specific services to receive notifications. Please take advantage of this feature!

In Metric Explorer, the "Difference" view now persists even when you apply filter conditions to a graph
To view the rate of accumulation for values that accumulate over time—such as counters—in Metric Explorer, it is convenient to click the "Difference" button to the right of the graph to switch to the difference view (this actually applies the irate function based on the specified time period).

We have improved the functionality so that when you apply a filter using "Label filter" at the top of the Metrics Explorer in this state, the differential value display on the graph is retained.
Notice: The appearance of alert Slack notifications will be changing
We are planning to update the appearance of alert Slack notifications in mid-May.
While Slack notifications for alerts are convenient for providing immediate updates on outages and recoveries, we've faced the challenge that "they contain too much information, making it difficult to grasp what's happening at a glance and potentially causing confusion."
With this update, our concept is to create notifications that "allow you to immediately understand the situation and easily navigate to the relevant screen," aiming to provide an experience that lets you focus on the alert response that requires your attention.


Please look forward to the new Slack notifications. We look forward to hearing your feedback and comments when they are released.
The expiration time set in SessionNotOnOrAfter now be used as the expiration time for login sessions using SAML authentication
As previously announced.
The "--quiet" option is introduced to the mkr command to suppress info-level log output
The mkr command, Mackerel's CLI, allows you to perform various operations. During these operations, the progress of the process may be output as a log. For example, when you post a metric using the mkr throw command, the result is displayed as "thrown 4UtG5hB8r6j 'custom.foo.bar 1.000000 1776160423'". However, in scenarios such as using the command within a script, seeing this output every time you run it might be considered cumbersome.
Although these processing logs are defined as info-level output, we have added the --quiet option to the mkr command to suppress info-level output. This feature is available in mkr v0.64.0 (included in mackerel-agent v0.86.2 on Windows) and later.
This feature was contributed by @fujiwara. Thank you!
Fixed the display of event IDs in the output messages of the check-windows-eventlog plugin
We previously announced that the check-windows-eventlog plugin, which monitors Windows event logs, now supports formatting output messages using format strings. However, the "Event ID" value displayed by this plugin differed from the value shown in the Windows Event Viewer and other tools.
We have fixed this issue so that the value matches what is displayed in the Windows Event Viewer, and have released this fix as part of mackerel-agent v0.86.3.
Notice: Supported Versions for the MongoDB Metric Plugin will be Changed
We are planning to update the supported MongoDB version for the MongoDB metric plugin (mackerel-plugin-mongodb) to "4.2 or later."
Future releases of the mackerel-agent-plugins package will include the plugin with this change applied. Please note that if you are using MongoDB version 4.1 or earlier, updating the plugin may cause it to stop working.
Notice of Support Desk Closure during the Golden Week
As previously announced, our support desk will be closed during the period below.
Holiday Closure Period
- From Wednesday, April 29, 2026, to Thursday, May 7, 2026
Regarding Inquiries
- Inquiries received during the closure period will be addressed sequentially starting on Friday, May 8, 2026.
- Please note that some inquiries received by Tuesday, April 28, 2026, may also be addressed after Friday, May 8, 2026, depending on the content. We appreciate your understanding.
We apologize for any inconvenience this may cause and thank you for your understanding.