Hello, this is Mackerel team CRE's ![]() id:kmuto . We sincerely apologise for the disruption caused by the recent outage and appreciate your understanding. We would like to inform you of the details of this update.
id:kmuto . We sincerely apologise for the disruption caused by the recent outage and appreciate your understanding. We would like to inform you of the details of this update.
- The Mackerel OpenTelemetry Collector is now available, enabling simple transmission of telemetry signals to Mackerel
- An Issues screen, which allows all APM-detected errors to be viewed in one place, has been introduced
- The "Post the graph to a channel" button is no longer displayed during operations with Viewer permissions
- Help page explaining Monitoring Logs now available
- Fixed an error in the EC2 Status Check Failed System metric within the AWS integration
- Migration of the Terraform provider for mackerel.io to an implementation using terraform-plugin-framework
- Current Report on the Metric Viewing Issue Occurring on 6 November 2025
The Mackerel OpenTelemetry Collector is now available, enabling simple transmission of telemetry signals to Mackerel
We have released the Mackerel OpenTelemetry Collector (v0.2.0), which allows you to easily send OpenTelemetry telemetry signals to Mackerel simply by setting the Mackerel API key as an environment variable!
Without complex configuration, you can send data such as telemetry received via OTLP and host resource status to Mackerel.
We provide Docker image, along with deb and rpm packages for Linux.
For example, when running with Docker, it would look like this:
docker run -e MACKEREL_APIKEY=*API Key* mackerel/otelcol-mackerel:latest
An Issues screen, which allows all APM-detected errors to be viewed in one place, has been introduced
When Mackerel APM detects an error within a span in a service trace, it groups similar errors together and displays them in that service's "Issues" tab, aiding detailed investigation. However, when operating multiple services, it was inconvenient to have to check each service individually when trying to identify which service an error occurred in.
To resolve this, we have created a screen allowing you to view issues across services.
Clicking "Issues" under "Traces" in the side menu displays all issues identified by APM. Clicking an individual issue opens its details, similar to the "Issues" tab.

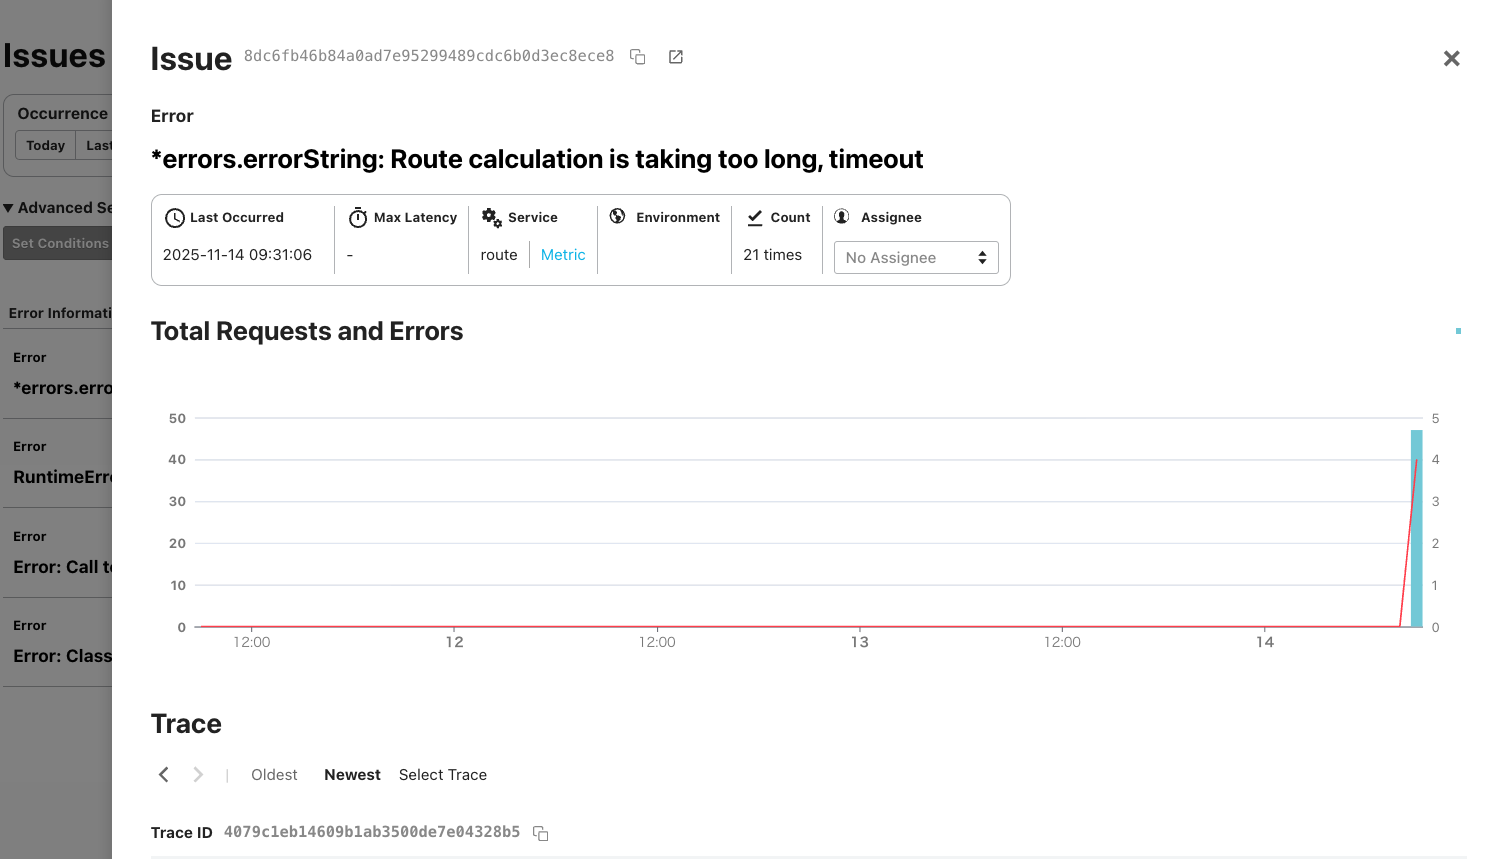
In addition to filtering by the latest occurrence date and time, service name, and assigned personnel, you can further refine results by clicking "Set Conditions" and applying criteria such as keywords, span names, latency, or count.
The "Post the graph to a channel" button is no longer displayed during operations with Viewer permissions
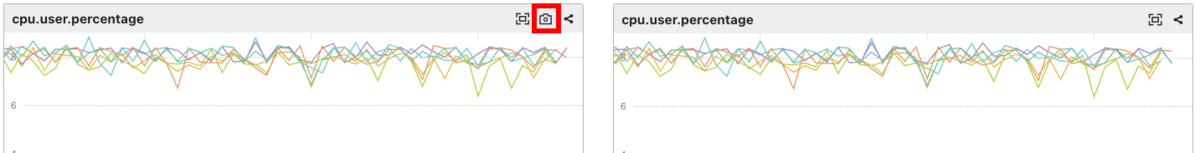
Clicking the "Post the graph to a channel" button located in the top-right corner of the graph allows you to send that graph to channels in Slack, Teams, etc. However, this functionality is prohibited for use with Viewer permissions.
Originally, this button was intended not to appear at all for Viewers. However, for some graphs, the button was still visible to Viewers. Clicking it would only display a message indicating the post had failed, creating a confusing situation.
With this update, the "Post the graph to a channel" button will no longer appear for any graph when using Viewer permissions.
Help page explaining Monitoring Logs now available
Using Mackerel's official check plugins, you can monitor logs such as:
- Log files
- Windows event logs
- Amazon CloudWatch Logs
While individual plugin descriptions have existed previously, systematic explanations focused specifically on log monitoring were lacking, and we frequently received enquiries from users about this.
We have now created and published a help page explaining these log monitoring features. Please take a look!
Fixed an error in the EC2 Status Check Failed System metric within the AWS integration
While you can retrieve EC2 metrics posted to CloudWatch using the AWS integration, it has been discovered that the Status Check Failed System metric (metric name ec2.status_check_failed.system) had been returning the same value as the Status Check Failed Instance metric (metric name ec2.status_check_failed.instance) for an extended period.
We have now implemented a fix to return the correct value for the Status Check Failed System metric. We apologise for the inaccurate values provided previously.
Migration of the Terraform provider for mackerel.io to an implementation using terraform-plugin-framework
We have released version 0.7.0 of the Terraform provider for mackerel.io. The migration to an implementation using terraform-plugin-framework is now complete.
Please note that changes to the behaviour via environment variables, which existed in previous versions, are no longer possible.
Current Report on the Metric Viewing Issue Occurring on 6 November 2025
From 6 November 2025 to 10 November 2025, some metrics will be unavailable for viewing Outage persisted, and we sincerely apologise for the considerable inconvenience caused to all users.
At the time of this announcement, metric viewing has largely returned to normal.
- All metrics with 1-minute granularity, as well as service metrics, role metrics, and labeled metrics, have been restored across all granularities.
- For host metrics with granularity of 5 minutes or longer during the period from 30 October 2025 to 13:00 on 5 November 2025 JST, restoration work is currently underway for organizations on subscription plans with longer display periods.