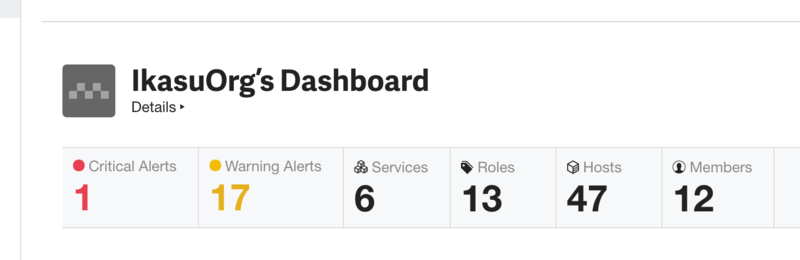
Number of active alerts, services and other information is now displayed in the dashboard.
Previously, recent alerts as well as recently added hosts had been shown in the organization dashboard. Now, in addition to those values, the number of currently active alerts, services, roles, and other information will also be displayed in the dashboard. The new dashboard makes it easier to assess the overall condition of your organization at a glance.
Hatena Group now supports Mackerel graph embedding.
It is now possible to embed Mackerel graphs in Hatena Group, a group ware service from Hatena. With Hatena Group you can embed a graph to a group keyword or other location and include checking graphs as a part of your everyday workflow. Furthermore, Mackerel graphs can also be embedded in Qiita:Team or any other service that can use iframe.
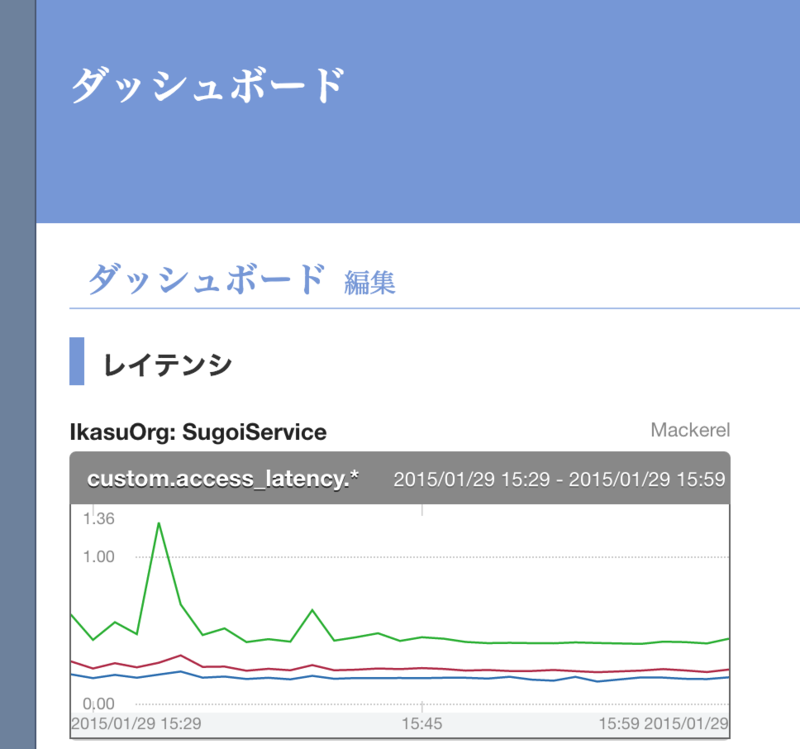
For more information on graph embedding, please refer to this past announcement.
fluent-plugin-mackerel version 0.0.9 has been released
fluent-plugin-mackerel, a plugin from @tksmd that posts data from fluentd to Mackerel, version 0.0.9 has been released. With this update, a flaw involving the handling of re-sending data when a posting error has occurred has been fixed.