Hello, this is Mackerel team CRE's ![]() id:kmuto . I would like to inform you about recent updates.
id:kmuto . I would like to inform you about recent updates.
- We have prepared a quick start tutorial for submitting traces
- Documentation for the tracing feature has been published on the Mackerel help page
- Made the display easier to understand when the span attribute value was an array
- Added a link to the metrics for that service from the trace details screen
- We also added support for deployment.environment.name as an attribute that represents the deployment environment
- Custom dashboards now remember whether or not the graph slider is displayed
- Attention: Beware of fake repositories that copy Mackerel's OSS repository and add malicious processes
- Absolute path specification for plugins installed with mkr plugin install is no longer required
- Memory peak information introduced in PHP 8.4 is now being used as a metric by mackerel-plugin-php-fpm
- We will release Mackerel's OSS container images on Docker Hub, GitHub Container Registry, and Amazon ECR registries
We have prepared a quick start tutorial for submitting traces
The Mackerel tracing function is currently available as a free beta version. However, even if you want to post a trace, you might be unsure where to start.
So we have prepared a 'tutorial' that you can use to practise posting traces to Mackerel using a small sample code.
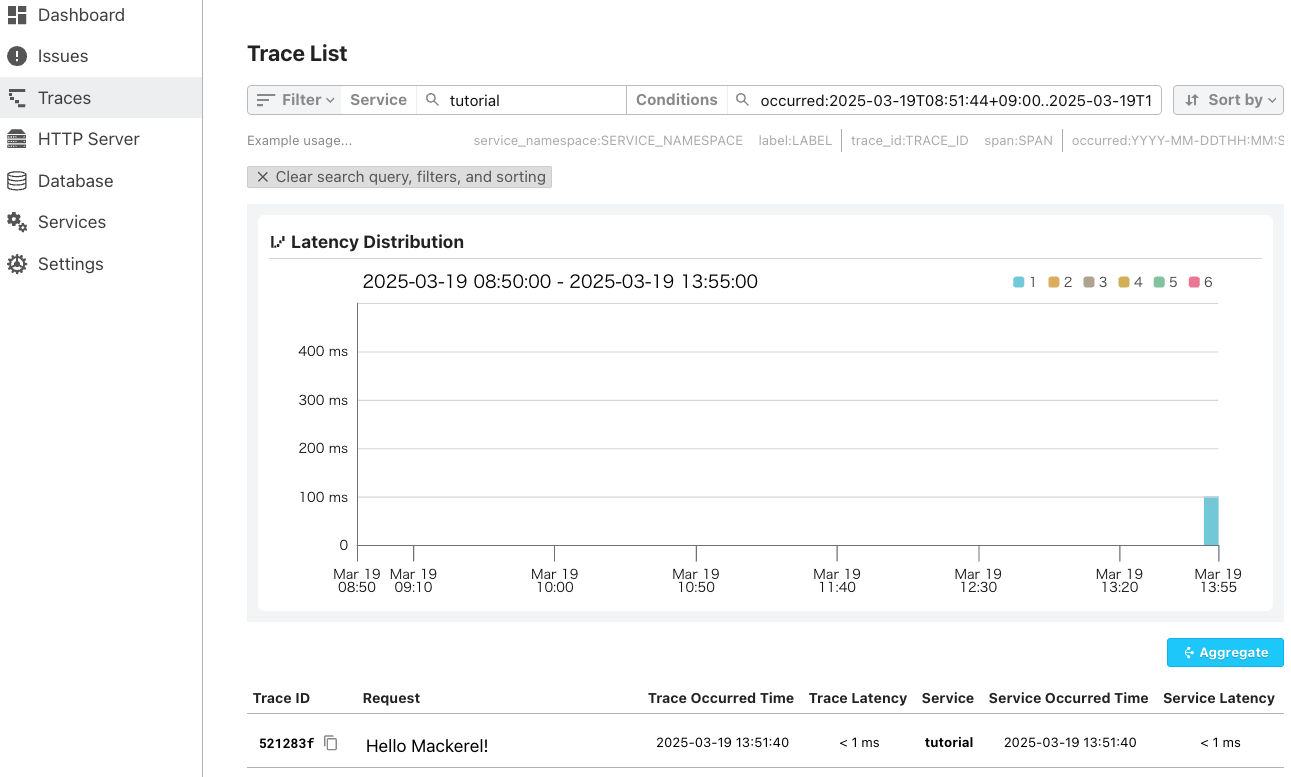
When you select 'Trace' from the Mackerel menu, if there are no traces posted, you will see a screen that says 'No traces available'. If you click the ‘Tutorial’ button on this screen, the tutorial screen will open.
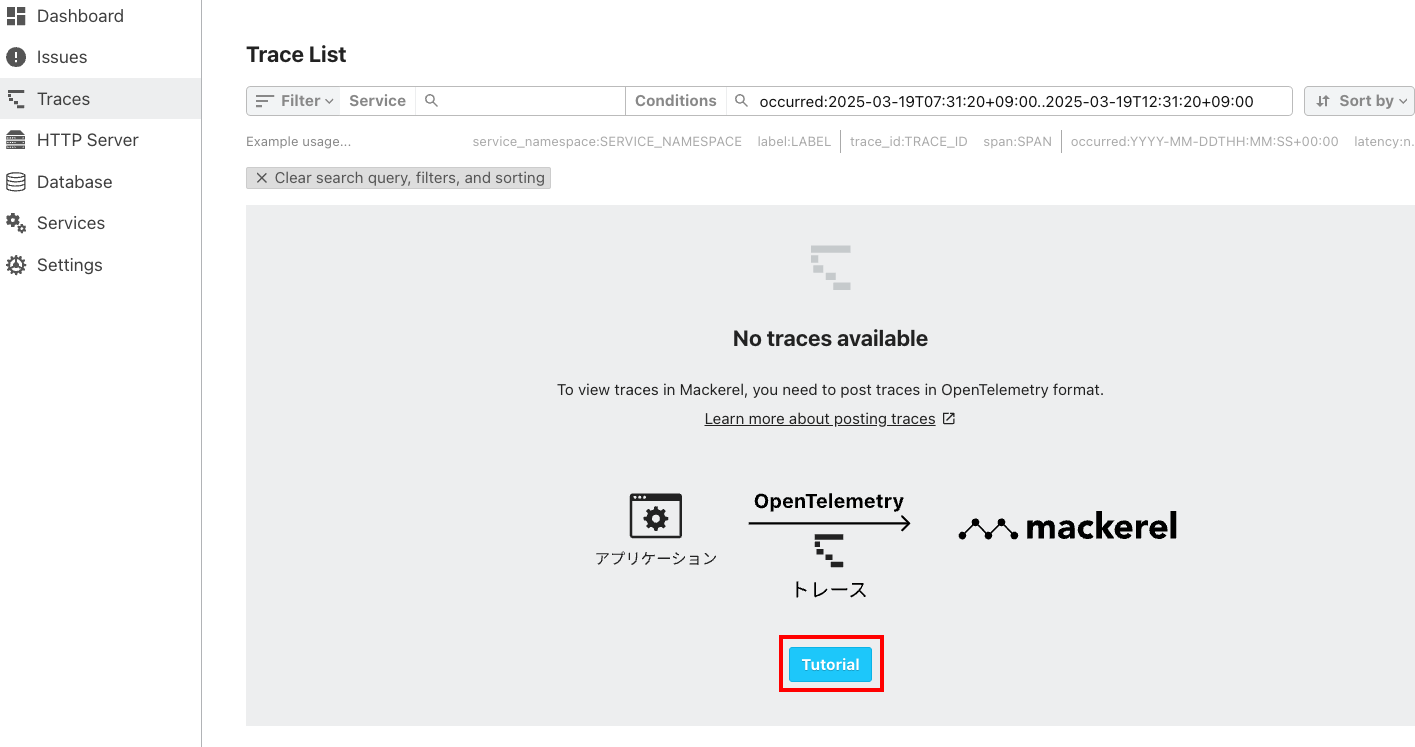
Please choose your favourite programming language and follow the instructions to try it out on your own environment. This will send a trace with the request name 'Hello Mackerel!' to the 'tutorial' service.
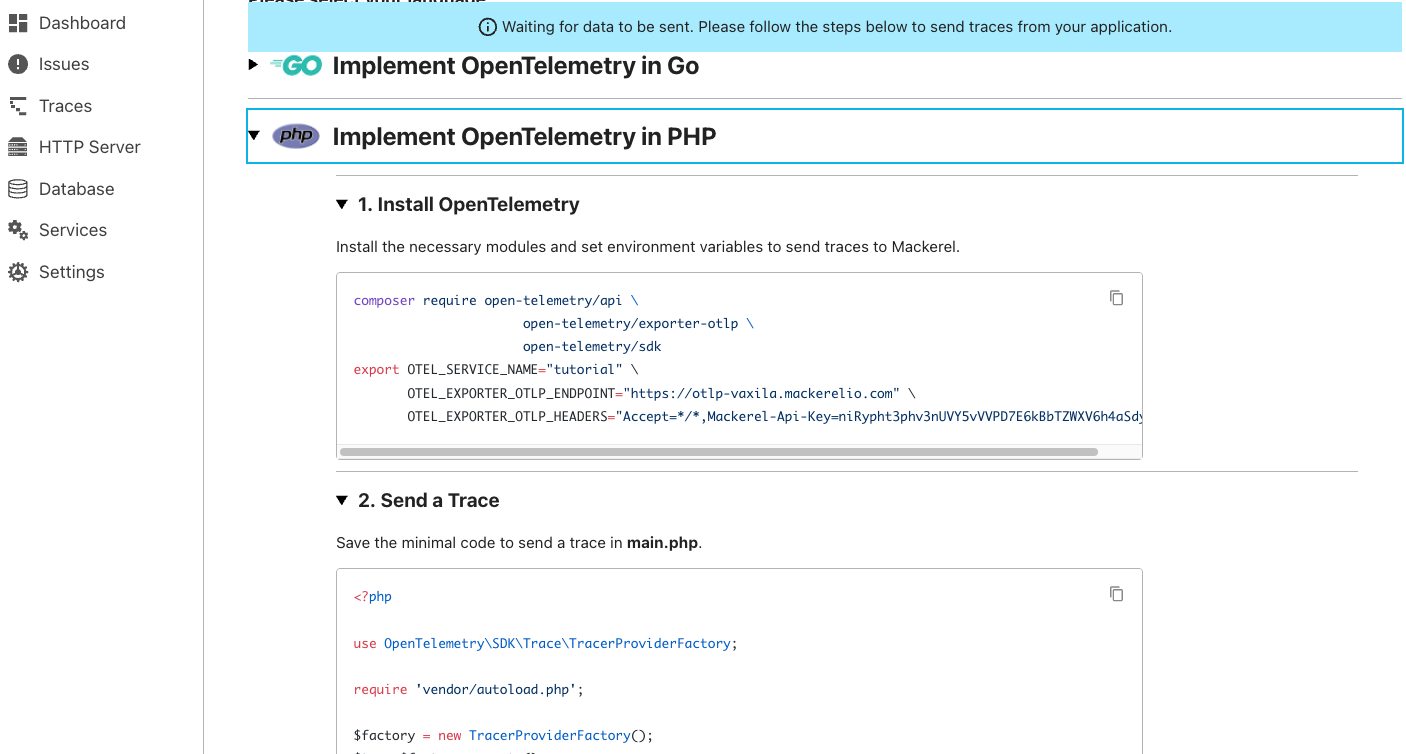
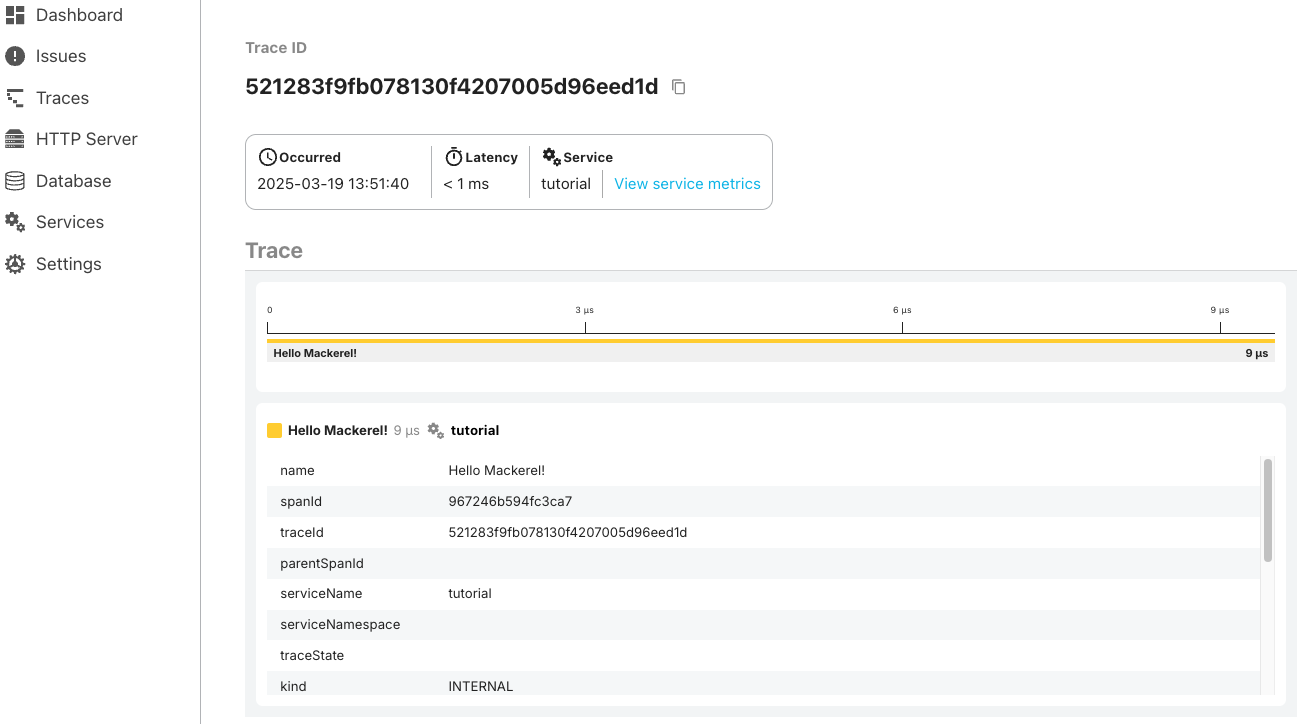
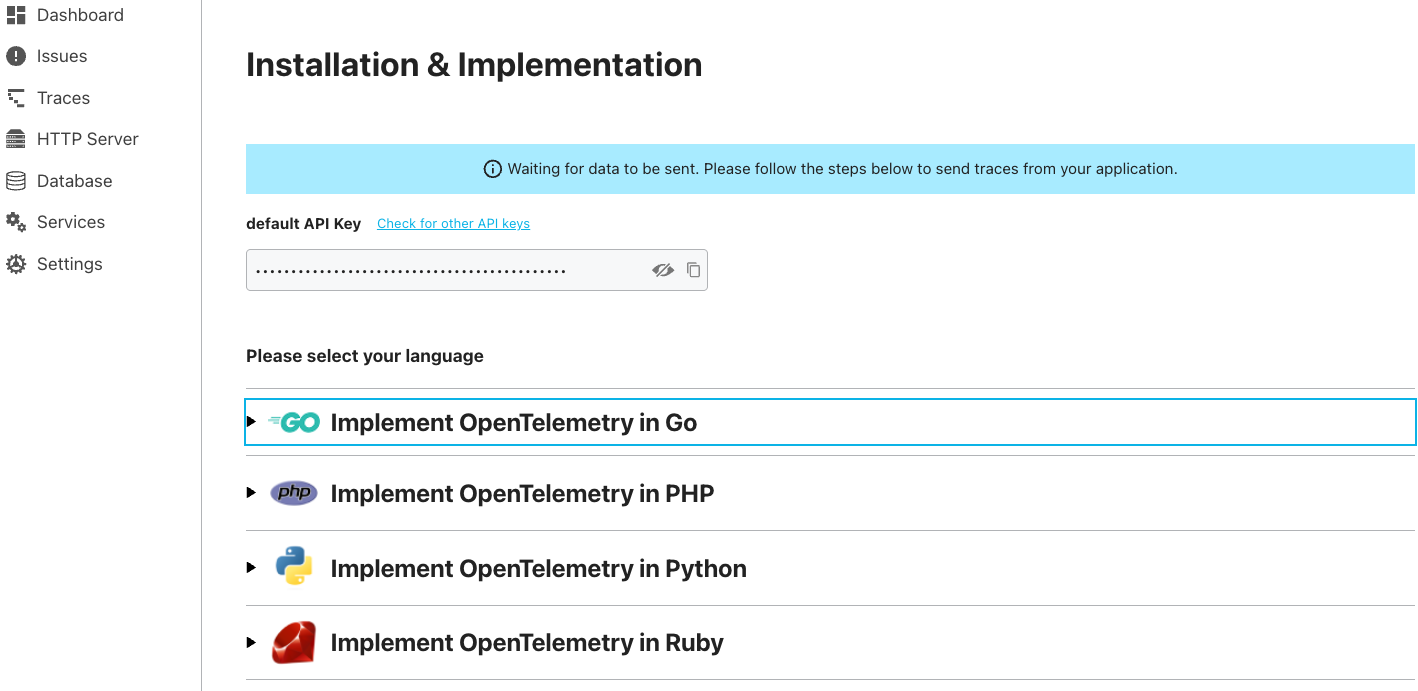
The programming languages supported by the tutorial are Go, PHP, Python, and Ruby as of the writing of this article. Let's get started with tracing using this tutorial. Links to more detailed settings for fully instrumenting your application are also included in the tutorial.
If you have already submitted traces, you can refer to the tutorial from https://mackerel.io/my/tracing/tutorial.
Documentation for the tracing feature has been published on the Mackerel help page
Documentation for the Mackerel tracing feature has been published on the Mackerel help page. At present, the information is only available in Japanese.
You can open various documents, such as an overview of the function and how to instrument each language, from the 'Tracing' hierarchy in the side menu of the help or the help top page.
We have moved the documents from the previous version of Vaxila and updated them to suit Mackerel, so please use them as a reference when using Mackerel.
Made the display easier to understand when the span attribute value was an array
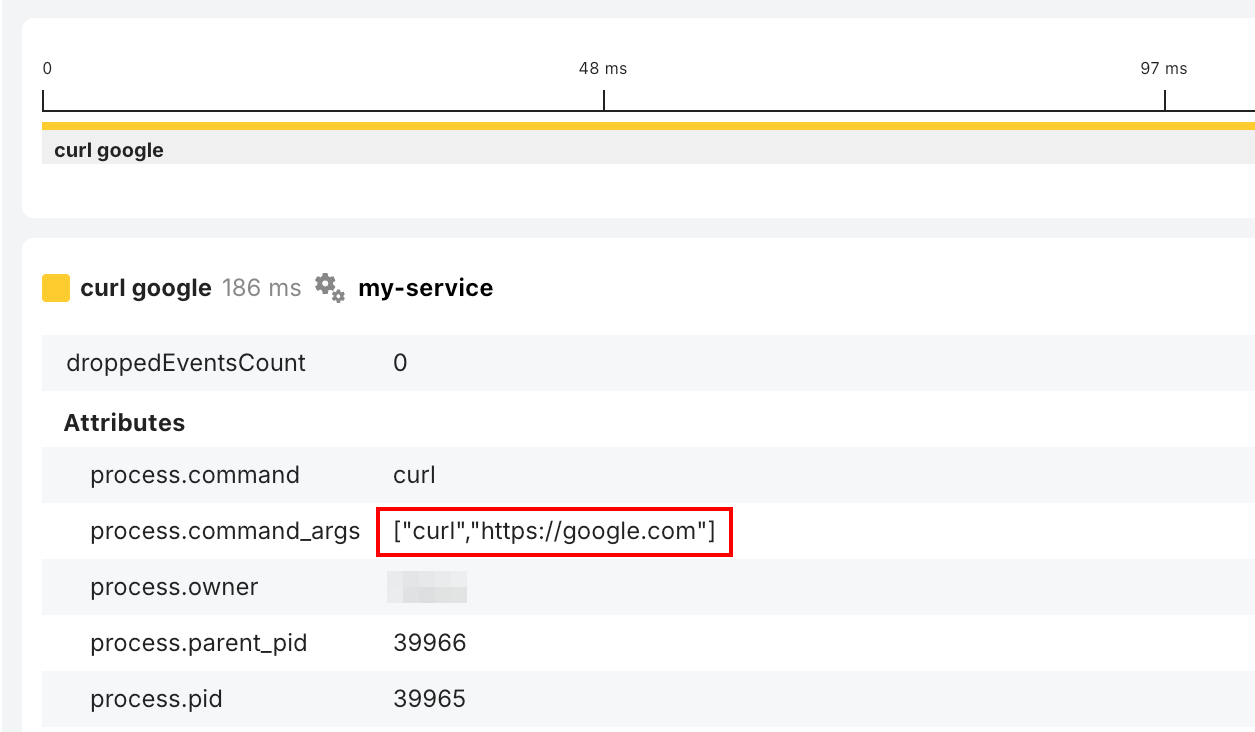
When the attribute value of a trace span was an array, the received data representation was used as is, and the display was difficult to understand at a glance, such as {'arrayValue':{'values':[{'stringValue':'curl'},{'stringValue':'https://google.com'}]}}.
When the value is an array, it has been improved to display it in an easy-to-understand way, such as ['curl','https://google.com'].
Added a link to the metrics for that service from the trace details screen
In the previous announcement, we introduced new function as 'Trace details now display a link to Explorer filtered by the post host information and approximate time of the trace'. It now provides a link to a labeled metric with the same name as the service name of the trace currently being displayed.
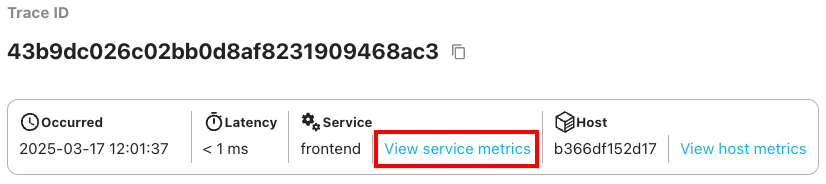
By sending signals for both traces and metrics to Mackerel, you can gain deeper insights into your application.
We also added support for deployment.environment.name as an attribute that represents the deployment environment
In addition to the existing deployment.environment attribute, we also support the deployment.environment.name attribute introduced in semconv 1.27.0 as an attribute that represents the deployment environment within the trace function.
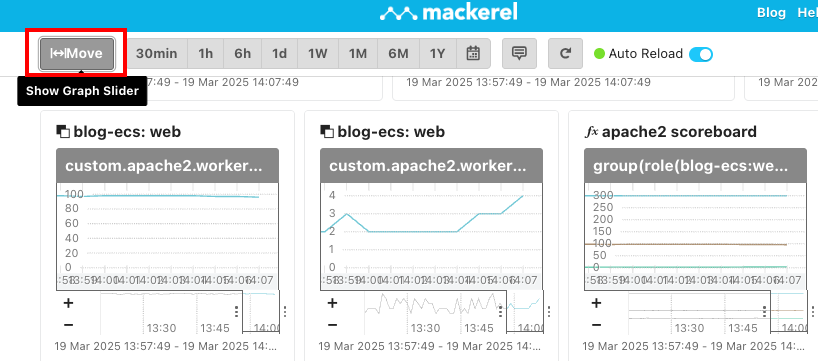
Custom dashboards now remember whether or not the graph slider is displayed
In custom dashboards, you can switch the display of the slider at the bottom of the graph on and off by clicking the 'Move' button. Previously, this switch was reset every time you reopened or reloaded the custom dashboard, but now the browser remembers the switch state.
Attention: Beware of fake repositories that copy Mackerel's OSS repository and add malicious processes
We have confirmed that a fake repository was published by copying the OSS repository published by Mackerel on GitHub and adding malicious processes. We have shared information about the fake repository with GitHub and are working on a response. Please be assured that there is no impact on mackerel-agent, etc., which are officially provided, including past versions.
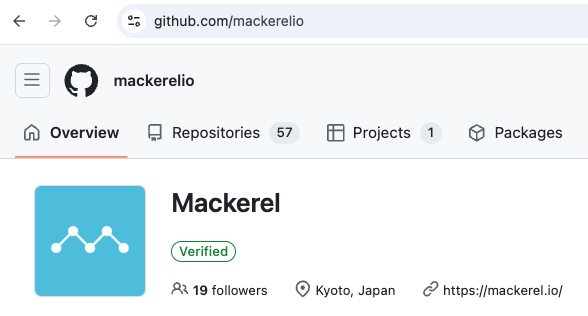
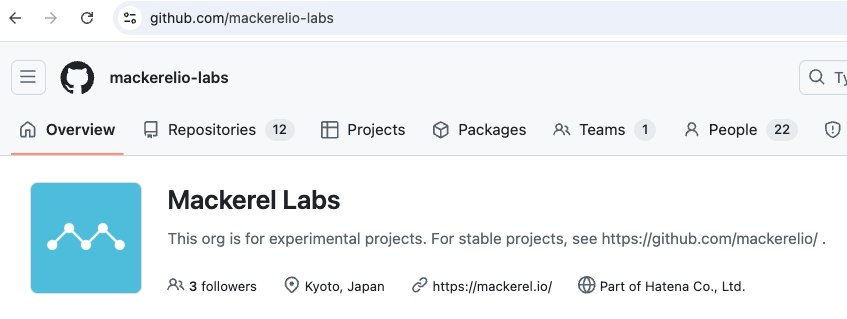
The OSS repositories published by Mackerel belong to the mackerelio organization or the mackerelio-labs organization.
In addition, the official Mackerel accounts are @mackerelio_jp (Japanese) and @mackerelio (English).
Absolute path specification for plugins installed with mkr plugin install is no longer required
In Linux environments, when you install an external plugin using the mkr command as mkr plugin install, the plugin executable file is placed in /opt/mackerel-agent/plugins/bin.
When you tried to set that plugin in mackerel-agent.conf, you had to specify the absolute path like command = ['/opt/mackerel-agent/plugins/bin/plugin-executable-file-name', ...] because the path was not set.
In mackerel-agent version 0.84.1, we improved the plugin path to be passed. As a result, you can now set plugins without specifying the path, such as command = ['plugin-executable-file-name', ...].
This fix was contributed by Mackerel user @fujiwara. Thank you!
On Windows, the files installed with mkr plugin install are placed in the plugins\bin folder in the mackerel-agent folder, so you can specify them with a relative path like command = ["plugins\\bin\\plugin-executable-file-name", ...].
Memory peak information introduced in PHP 8.4 is now being used as a metric by mackerel-plugin-php-fpm
In PHP 8.4, a 'memory peak' field was added to the php-fpm status page, showing the maximum memory usage since the PHP runtime was started.
We have modified the mackerel-plugin-php-fpm plugin, which turns the information on the php-fpm status page into metrics, to turn this memory peak value into a 'PHP-FPM Memory Peak' graph. This is available in mackerel-agent-plugins version 0.88.0 or later.
If the memory peak value is 0 or does not exist in versions older than PHP 8.4, the graph will not be generated.
We will release Mackerel's OSS container images on Docker Hub, GitHub Container Registry, and Amazon ECR registries
Mackerel develops and provides a variety of OSS. For container environments, we distribute images such as mackerel-container-agent and mackerel-sql-metric-collector via container registries, but until now there has been no consistency in their locations. From now on, we will release the following container images to three registries: Docker Hub, GitHub Container Registry (ghcr.io) (mackerelio and mackerelio-labs), and Amazon ECR.
- mackerel-agent
- mkr
- mackerel-container-agent
- mackerel-sql-metric-collector