Thanks to all of you, the Mackerel Advent Calendar that we talked about last week has been completely filled!
qiita.com (Japanese only)
Thank you!
Also, be sure to check out the advent calendar that Mackerel team CRE id:Soudai is working so hard on, not missing a single day and continuing to release blogs full of information and useful knowledge.
qiita.com (Japanese only)
I hope you enjoy these advent calendars leading up to Christmas.
Now onto this week’s update information.
Customized (expression) graphs can now be added to GraphBoard
"GraphBoard" is an interactive feature that lets the user freely arrange arbitrary role and service metrics graphs.
With this week's update, we’ve increased the number of types of graphs that can be added to this GraphBoard. Customized graphs (expression graphs) can now be added!

- Overlay server load statuses for the current week and the previous week and display as one graph
- Display the calculated maximum value/average value/minimum value of the server load belonging to a particular role
Customized graphs are extremely useful and allow you to implement the above procedures by describing the function expression. We believe that putting this to use will be even easier than before.
Displaying customized graphs is an experimental feature. For more details, check out the following help pages.
You can now configure the max number of attempts for host/service metric monitors
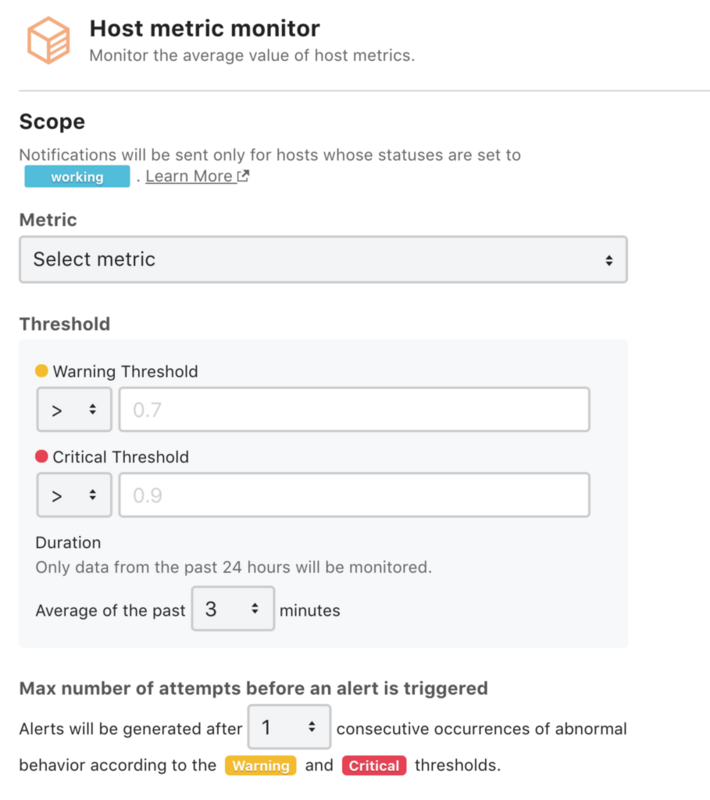
As you can see in the image above, the "Max number of attempts before an alert is triggered" can be configured with host metric and service metric monitors.
Up until now, only the monitoring of “Duration” (average of the past n minutes) was supported. For example, if you wanted to have an alert occur when a threshold of 5 is consecutively exceeded, you would configure the following.
- Threshold of
5 - Duration of 3 minutes
However, with this configuration, not only would a progression of 7 → 5 → 6 (a 3min average of 6) lead to an alert occurrence, but also for a progression such as 1 → 16 → 1 (in this case, also a 3min average of 6). For this reason, sometimes unintentional alerts would occur.
With this update, you can eliminate cases such as the one above by utilizing the newly added "max_check_attempts". We hope that you can use this feature together with "Duration” monitoring to eliminate unintentional alerts.
Our support window will be closed for the holidays
Both methods of contacting our support team, either through support@mackerel.io or the “contact our support team” option displayed in the upper right header when logged into Mackerel, will be closed during the following dates for the New Year’s holidays.
New Year’s holiday period :Thursday, December 28th, 2017 - Wednesday, January 3rd, 2018 (JST)
All inquiries received during this period will be handled sequentially starting from January 4th, 2018 (Thursday).
Please review your server monitoring settings and contact us if you have any concerns before the end of the year holidays begin!