Hello! Mackerel sales engineer Inoue here.
This Wednesday, we held the Mackerel Drink Up #5 Tokyo event. Being visited at our Hatena office in Tokyo by those who have been using Mackerel on a daily basis, and enjoying delicious food while discussing Mackerel stirred up quite the sensation!
Halfway through we began lightning talks (LT), which had the venue wrapped in laughter from beginning to end.
We had great success in holding Drink Up #5, and plan to hold various other events in the future. If there is anything you might like to attend, by all means do come along.
Anyway, here is this week’s update information.
Updated agent installation process page
If you are a Mackerel user, you will likely have seen the Mackerel agent installation process page before. With this week’s update, this page has become even more intuitive and easier to use.
Some of Mackerel’s special features are its incredibly easy installation process, and the speed in which monitoring can begin; we highly recommend Mackerel to those who may not have had any experience with server monitoring before. Further, if there is anything you feel that we can do to make the startup procedure even easier, please do not hesitate to leave feedback!
Settings to combine stacked and line graphs can now be found within UI settings
It is now possible to change the settings within the UI for Mackerel’s metric graphs, so as to display both the “stacked graph,” which displays the value of each metric stacked one on top of the other, and the “line graph,” which displays data as overlapping line segments, on top of one another.
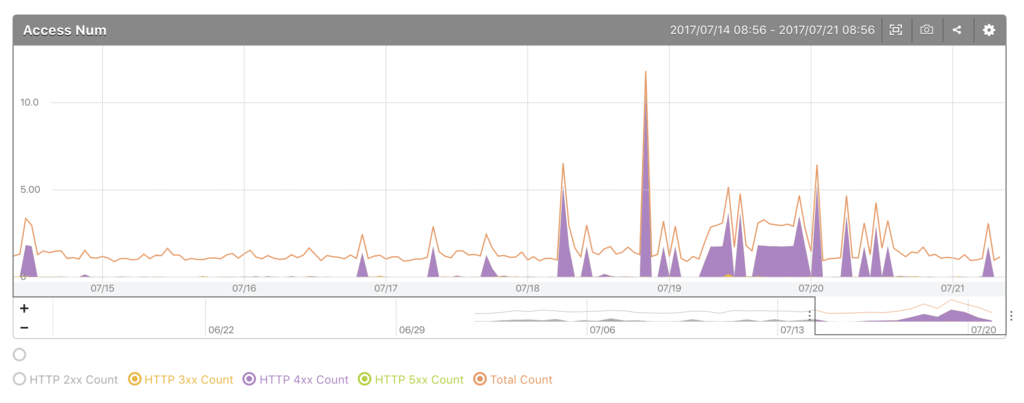
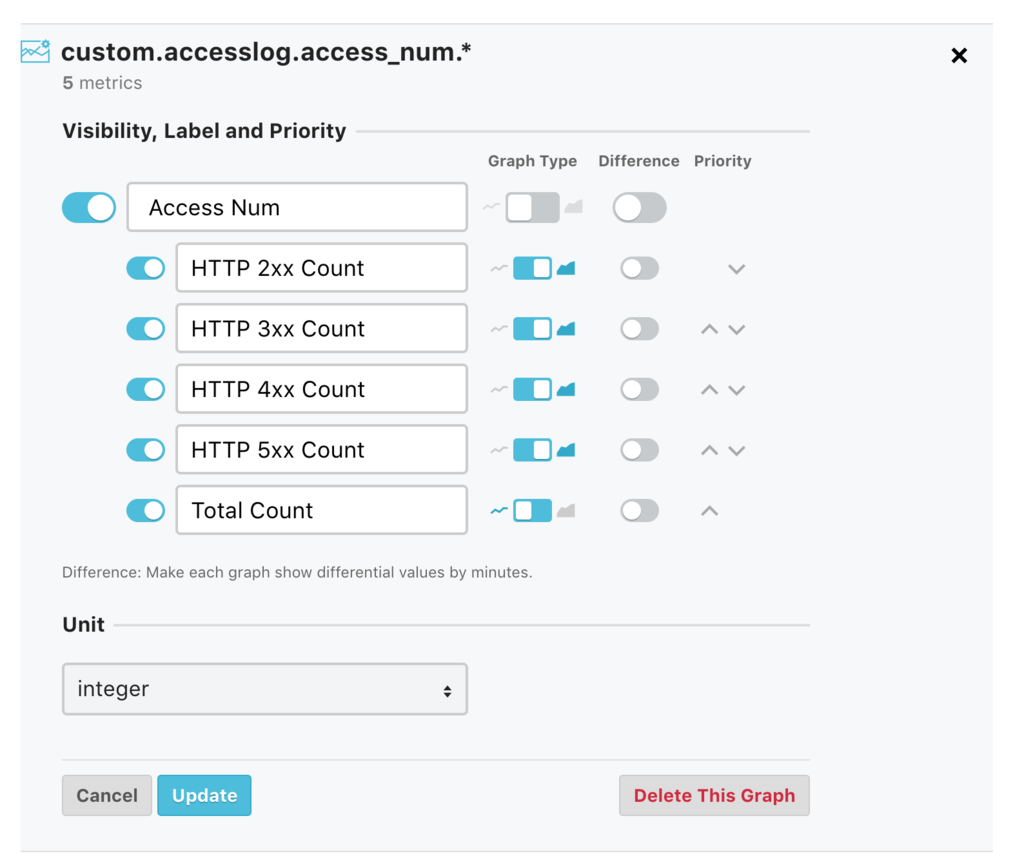
These settings can be accessed by either displaying “Graph Definitions” by clicking on the gear icon in the upper right-hand corner of the graph, or through the Graph Definition Edit Screen (this can also be set with service metric graphs). Please try it out!