
Credit Saison Co., Ltd.
Credit cards, leasing, finance, real estate and more
Date of publication: June 30, 2015 · All information contained herein is accurate as of when this interview took place.
Let's begin with some brief self introductions.
Hisamori
My name is Tatsuo Hisamori ( id:myfinder / @myfinder), I'm a server-side engineer at M.T.Burn. M.T.Burn is a joint investment company of Freak Out and Ignis that is operating as an ad network geared towards smartphones. Originally I was in charge of the construction and operation of infrastructure, as well as ad distribution at Freak Out. At first, bringing in Mackerel started with just me and then we gradually started moving forward adding more members.
Moriyama
My name is Kosei Moriyama ( id:cou929 / @cou929). As an engineer at M.T.Burn I'm responsible for server-side operations.
Yoshimuta
My name is Yohei Yoshimuta ( id:yoheimuta / @yoheimuta) and I'm an application engineer. I'm primarily responsible for the SDK that goes into iOS and Android applications but I'm doing ad server development as well.
Native ad network Hike, by M.T.Burn | offering cutting edge ad technology 
Tanaka
My name is Shinji Tanaka ( id:stanaka / @stanaka) and I'm in charge of the planning and production of Mackerel at Hatena.
Tell us about the events that led up to installing Mackerel.
Hisamori Our first encounter was in May or so, 2014, just before Mackerel's beta release. We dropped by Hatena one day and heard from Mr. Tanaka, "Hey we're working on making this new service..." so once we got back we went ahead and installed it on ten or so of our hosts to see if it would affect other software or not. After that, M.T.Burn's ad network business was taking off and there was some concern about our infrastructure as the service expanded, so we decided to migrate to the cloud. We wanted to reduce the labor involved in increasing and decreasing our servers flexibly, so from that standpoint when we started thinking about monitoring tools, we thought "Actually Mackerel might be the way to go."
What was the deciding factor for going with Mackerel?
Hisamori One factor was that it was in active development. So as an early user, our particular circumstances were taken into account and they really listened to our feedback. The developers actually understood what kind of situation we were working with.
And what about from Hatena's perspective in respect to M.T.Burn bringing in Mackerel?
Tanaka Ad tech is big right now, so we're happy to have Mackerel being used in that field. Also, with typical web services we understand what is most vital to those, but that's not necessarily true of services in other fields, so I think that as Mackerel is used in a wider variety of applications it will continue to grow into a more versatile tool.
What were everyone's first impressions of Mackerel?
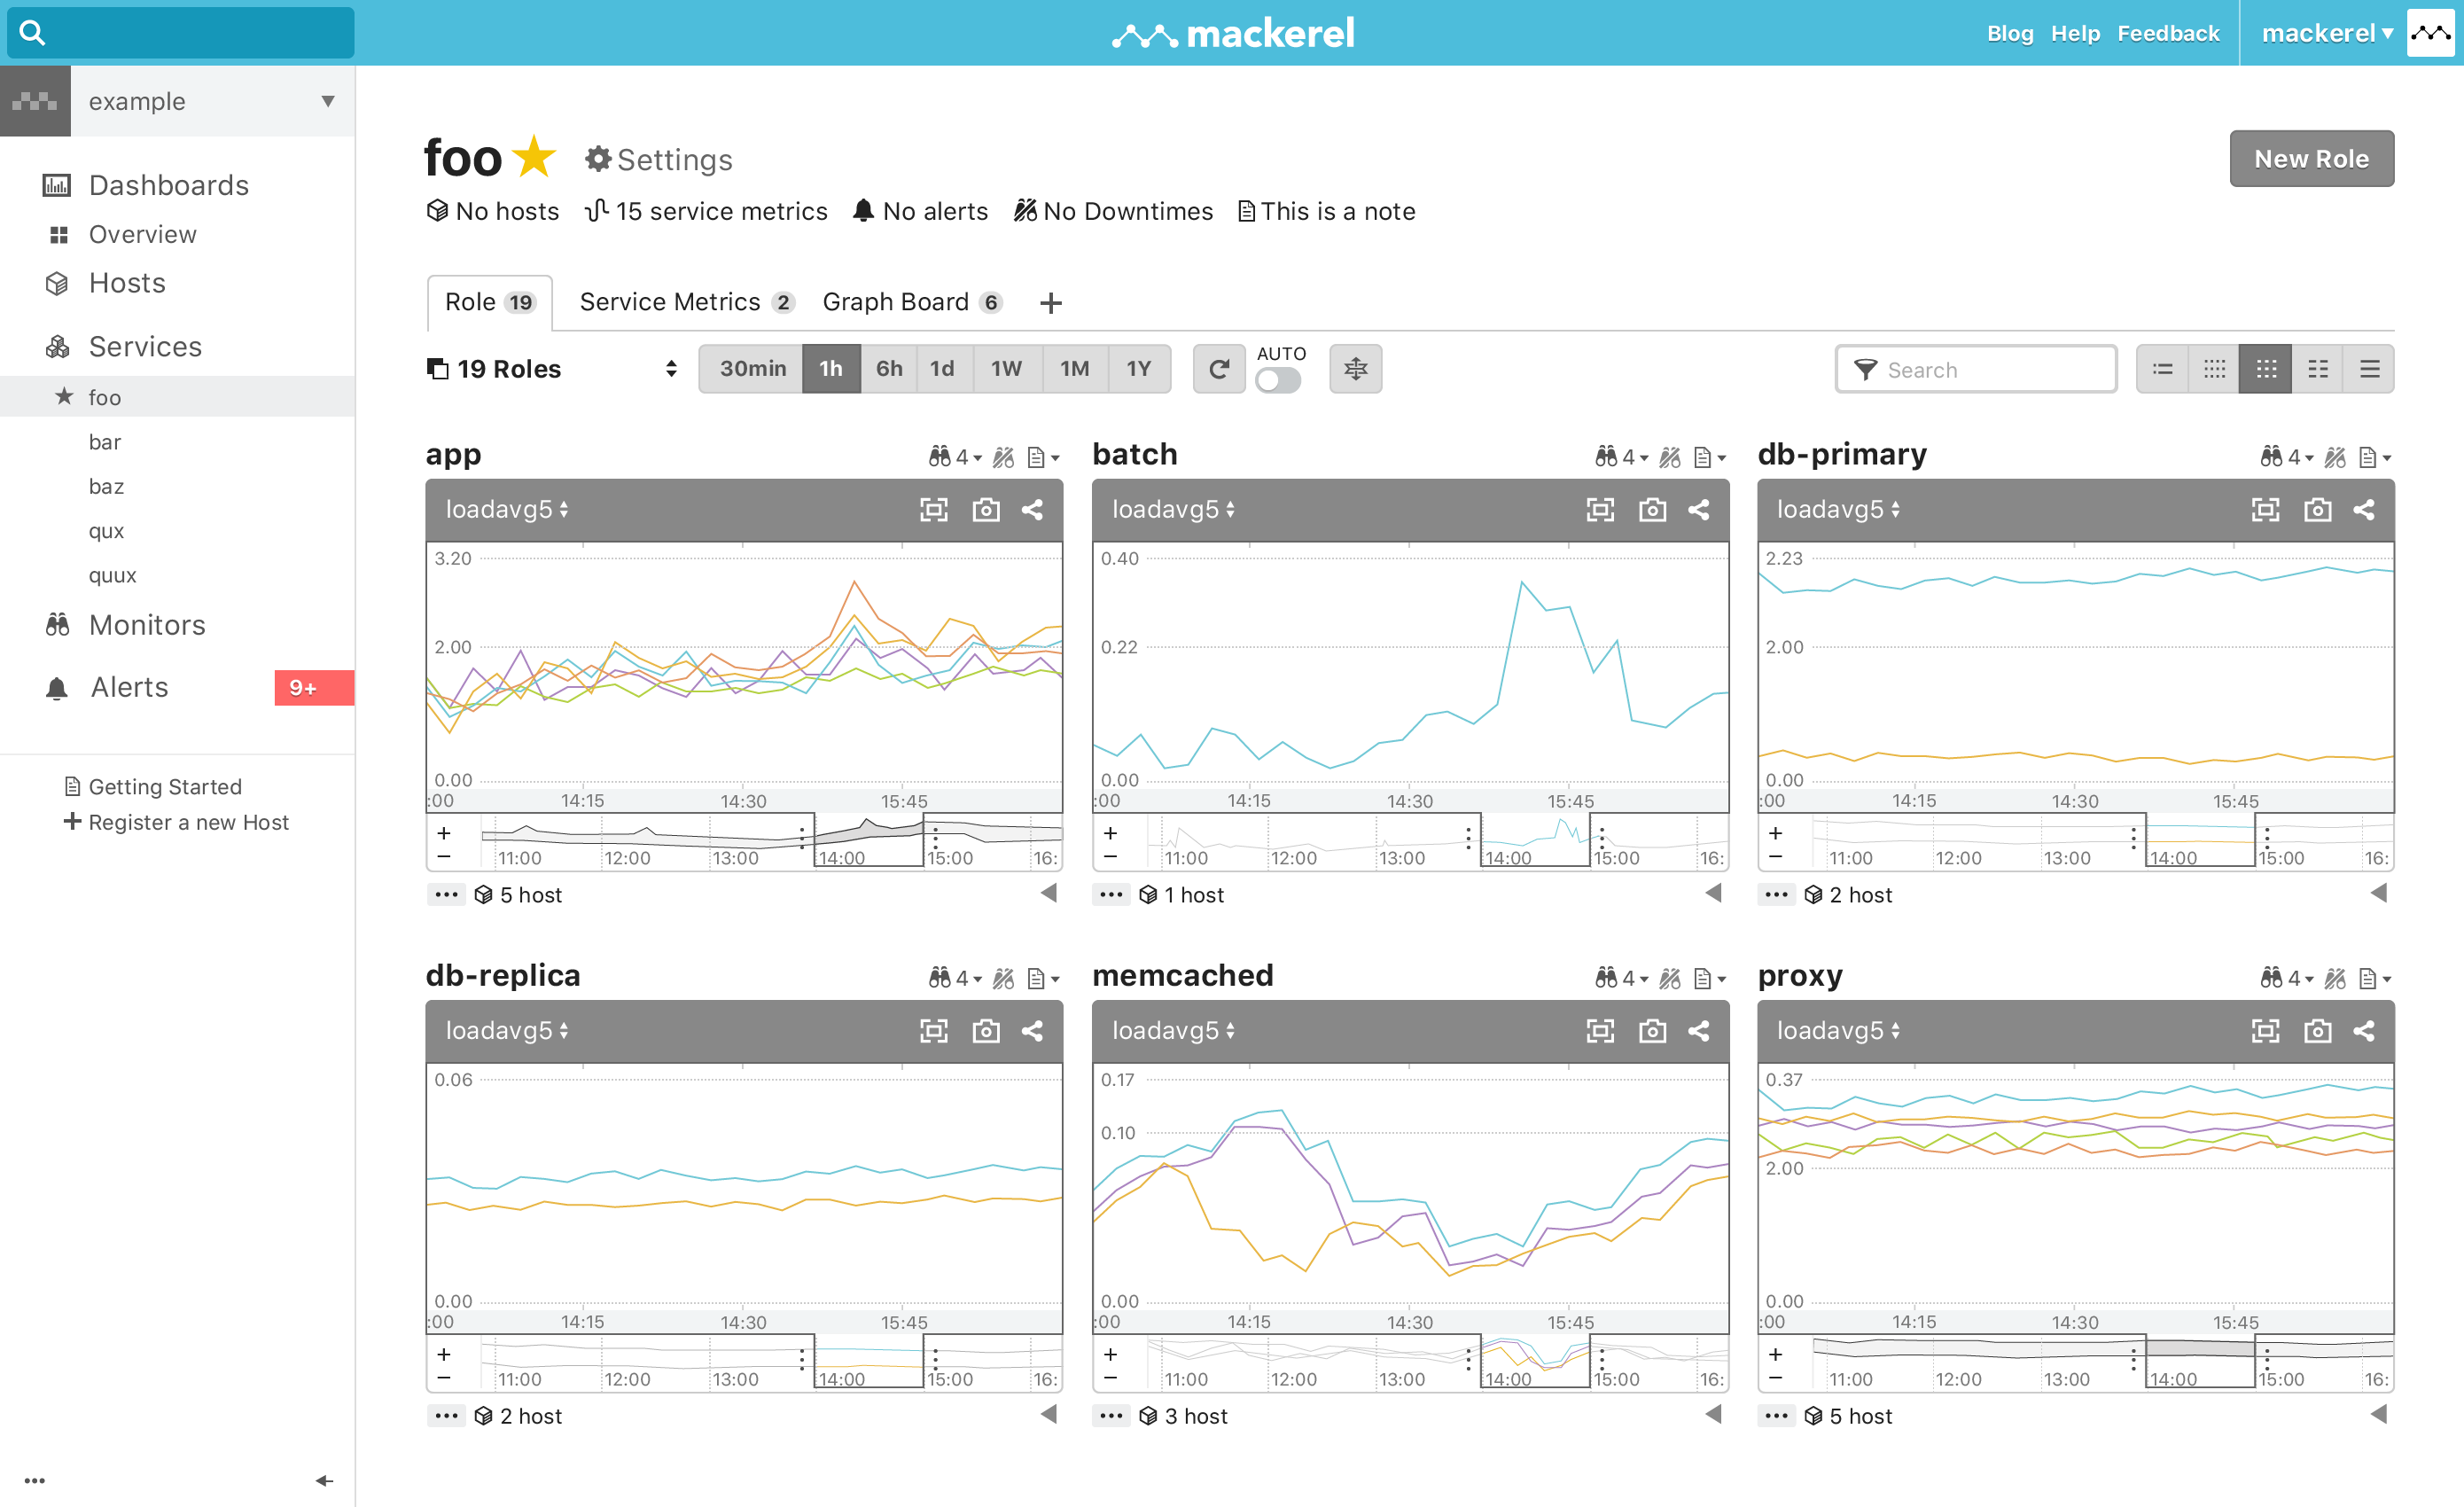
Moriyama When I first got my hands on Mackerel I thought it had a kind of modern appearance. Changing the span of graphs and viewing the metrics and stuff can be done interactively. It was like, "Ok this is a next gen tool right here." (laughs) Even looking at the menu there wasn't anything that looked confusing. My first impression was that it seemed like something I would immediately be able to use.
Yoshimuta Once we got into developing SDK for Android and iOS we started using New Relic as a monitoring tool, but shortly after that is when we came across Mackerel. Just looking at it I got a sense that with this, if any problems come up we can figure it out. Mackerel was easy to understand, so we were thankful for that.
Tanaka At Hatena as well, we had been using an OSS monitoring tool but it was built so like, only a person who gets it can understand, so when we didn't know exactly what to do we had to fumble our way through using it. We thought we have to do something about this which brought us to the point of creating Mackerel and consulting with a designer. We were like "Lets make something simple, easy to use, and cool."

About how long have you been using Mackerel?
Hisamori We started using Mackerel around August of 2014, so a little over half a year.
Tanaka They're one of our first users who started using Mackerel around when we were trying to decide whether it was time to officially release it or not. At Hatena we were pretty excited too. With autoscale being applied in the trending ad tech field, we were thrilled to see Mackerel being used more than we imagined, so it was a really interesting thing for us to see how it worked out.
Hisamori Since the time we first started using Mackerel the number of features has increased considerably too. Every week something new gets added.
Post list - Mackerel Blog '#mackerelio 
And what about feedback for Hatena?
Hisamori Using the feedback feature to casually send requests and questions, getting responses from their team... we were able to have that kind of exchange. Like recently we requested the addition of alerts for service metrics and it was actually implemented, which was great. We use it to watch our service indices too, like sales and application error rate, etc.
Mackerel Features - Visualize and keep track of all your data using service metrics. 
Moriyama You can see that the GUI is being improved week by week, like when the feature to change the graph view to rows of three was added.
Yoshimuta A new feature gets released on Friday every week and we get a "This week's Mackerel update" newsletter, so we look forward to that. Seriously we get pumped on Slack like "It's finally here!" It's exciting to see what kind of feature will come next, for example when they changed it so only the graphs reload and not the whole page, I was like, this is nice. It feels stressful reloading the whole page, but not if it's just the graphs.
Graphs are now able to be refreshed on-screen - Mackerel Blog #mackerelio 
Tanaka Although Mackerel is a B2B service, it's updated weekly, which probably is something that comes from our background in B2C service culture. So with big enterprise services you often see large scale updates once every few months, but we take a slightly more casual approach, adding new features one at a time as we go.
Once more could we have you describe the setting when it was determined that Mackerel was needed at M.T.Burn?
Hisamori At our parent company Freak Out, we had started offering our service by borrowing hosting space on our own data center. We fit well with this style, which would be called DSP (Demand-Side Platform). With this, it was easy to investigate traffic peaks and we could negotiate prices easily. On one hand, being in the ad tech industry, the challenge at M.T.Burn was that when big media participated, we could expect traffic to suddenly double or even increase by 10 times. If you're gonna set up on-premise, server reinforcement alone is going to need a month or so to do. That's gonna slow down getting launched, but with the cloud we can get around that. That's the direction that brought us to come to our consensus.
What were you most pleased with about Mackerel?
Hisamori If we had just switched over from on-premise to an IaaS it wouldn't have been necessary to change our tool set, but it would've cost more. So we were like what should we do? We needed a system with a more cloud-like structure. That way we can ensure we have the necessary resources when we need them, and when they're not being used we can scale back down. With that flexibility we can keep pace with traffic at peak times using autoscale. When a problem comes up, we want to see metrics so we can know where in that service the problem is, you know? But with Munin and other monitoring tools we had used before, they weren't built to work with autoscale. What really fit well with our service was the cloud-like approach to handling monitoring that Mackerel's roles structure allows.

Tanaka Open source tools that came before cloud services like AWS (Amazon Web Services) became widespread were conceived for primarily on-premise use. They weren't built with the idea of components operating dynamically, so it just becomes a big hassle. You really see how old the designs of these tools are when paired with AWS. For example, keeping up with your server list with increases and decreases in the number of servers using a monitoring tool. With older tools this kind of simple task was a pain. So there's this big gap between tools that require someone with a lot of experience to use and tools that don't require any experience at all to use.
Hisamori One problem is that there are a lot of things we had to be careful about, like when we'd have to add or delete from the server list or update it, we'd get a failure to update. It's not good when you have a situation where a server is part of a service but for some reason it's not being monitored. So that's an extremely important point for us. With Mackerel we don't need to worry about stuff like that.
Tanaka There are two main reasons why I think Mackerel has become a product that is in line with the times. One is the paradigm shift that happened when the cloud was introduced. The other is the change in trend from using in-house developer tools to using third party services like GitHub Enterprise or Slack. I think the combination of those two things have been to our advantage.
Moriyama From the standpoint of building an application, we were thankful Mackerel doesn't require a specialist to use. Anybody can use this, not just people dealing exclusively with infrastructure. The cost in terms of time spent learning to use it is low, so we can put that back into our actual business.

Yoshimuta With our application's warning logs, we once tried to build a system where if events are few it's ok to ignore them, but if there's a lot they'll be detected. Typically you would have an infrastructure engineer build this kind of function, but this time around we were familiar with Mackerel and we knew how to use the API, so we tried to make it ourselves as application engineers. Even without being particularly experienced with infrastructure we were able to implement this kind of structure using and integrating log OSS stream processor middleware to post events to Mackerel. There was an event we detected using this structure where media partner payment settings were failing. If the number of events had been low it would probably just be our test environment which is ok to be ignored, but if they were high there'd be a good chance that there's a failure occurring in the production environment media partner side. Within a few minutes of the event we were able to realize something was happening, so now we're able to defend against media partner payment failures with a high level of accuracy.
Tanaka I think that's an excellent way to use Mackerel. Mackerel is at it's core about server monitoring, but it can also be used to visual service KPI (Key Performance Indicators). In the beginning we had conceived it to be used to monitor things like service response time and error rate, but we started realizing that Mackerel could have many more uses, so we're very pleased to see our service being used to solve problems like this in the Ad tech field.
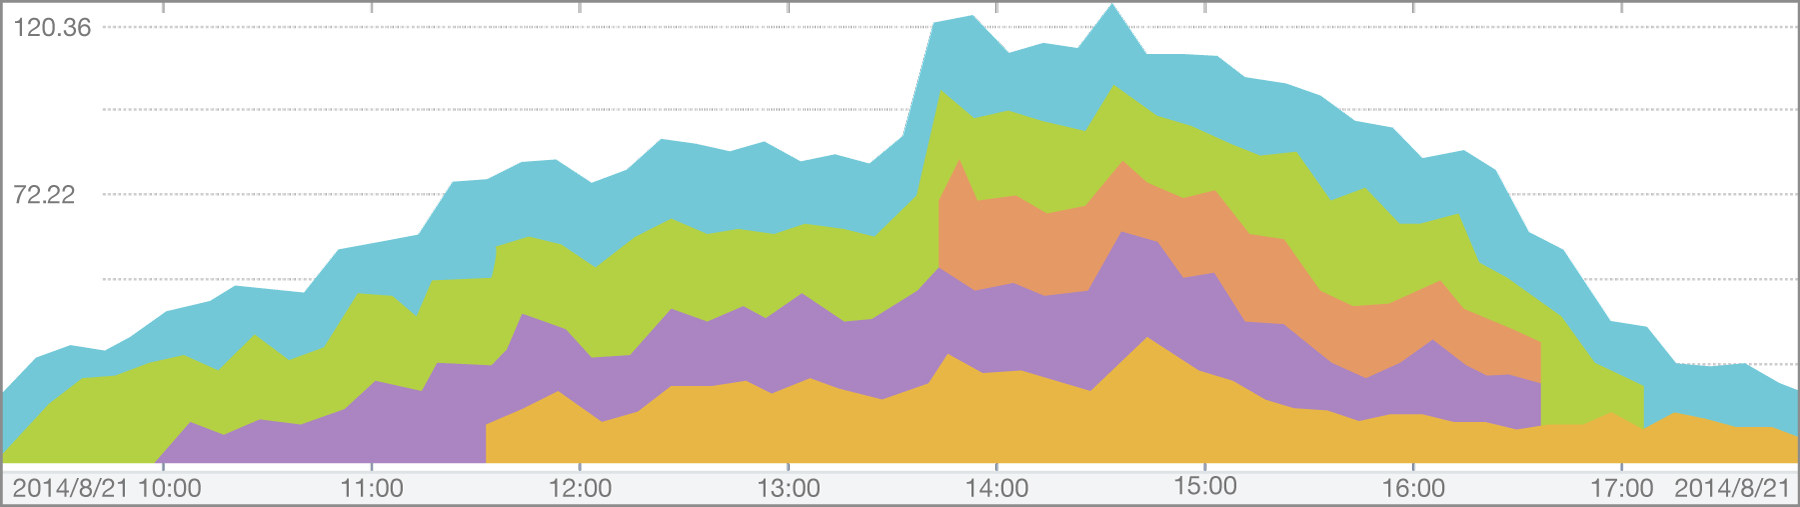
Hisamori Speaking of KPI, we're producing sales graphs in one-minute intervals. In the graphs if the red line goes above the blue line it means we're in the red. This graph gets produced every minute.
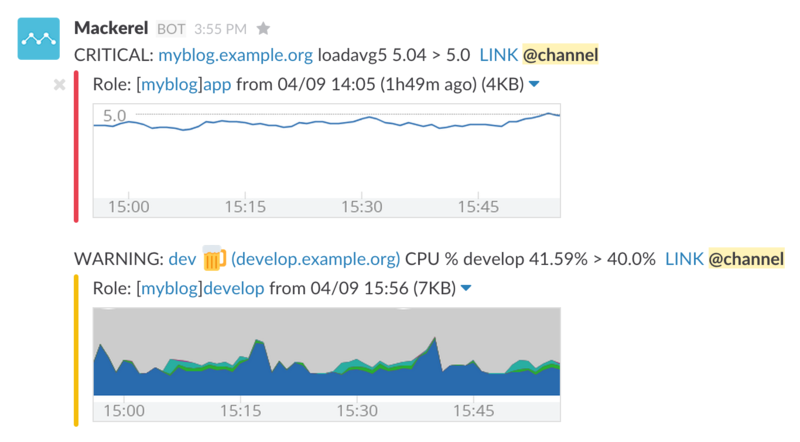
Moriyama We're using Slack notifications too. For example we get notifications for things like CPU consumption, and recently not only notifications but we've also got our latest graphs streaming in Slack.
Hisamori What's great about that is just looking at Slack is sufficient. Without having to change screens we can see the latest graphs in Slack, and only if it's necessary to look into something further then we can change views and see that information in Mackerel.
Tanaka When you can see graphs it's possible to get an idea of the level of urgency. It changes how you handle determining whether a certain parameter is gradually increasing or if it's suddenly jumped up.
What's one of the biggest things that changed since installing Mackerel?
Hisamori We realized we had to change our whole philosophy about how we manage our resources. In the past we'd have a server master list, and maintaining that was a job itself, but once we made the transition to the cloud our management structure made a 180 degree turn. Rather than giving so much time and attention to managing the master list, we entrust that to our monitoring tool. Until then we were all on-premise, so we'd have to manage server information on our database by running it through a management tool, but then our thinking changed and in place of that we started focusing on managing our servers with Mackerel. As a result we were able to modernize our operation, cut down on labor, and focus on creating the original value of our product.
Moriyama Keeping status info on servers means it's going to be difficult adding and taking out servers quickly. We had to change our way of thinking, so now we keep data outside servers allowing easier expansion and contraction.
Tanaka The demands of web systems are evolving, immediately available resources are becoming more and more dynamic, and servers are increasing and decreasing in number, so, questions have to be asked like to what extent can appropriation of resources be optimized? Providing solutions tailored for the current state of the web is the core concept of Mackerel.
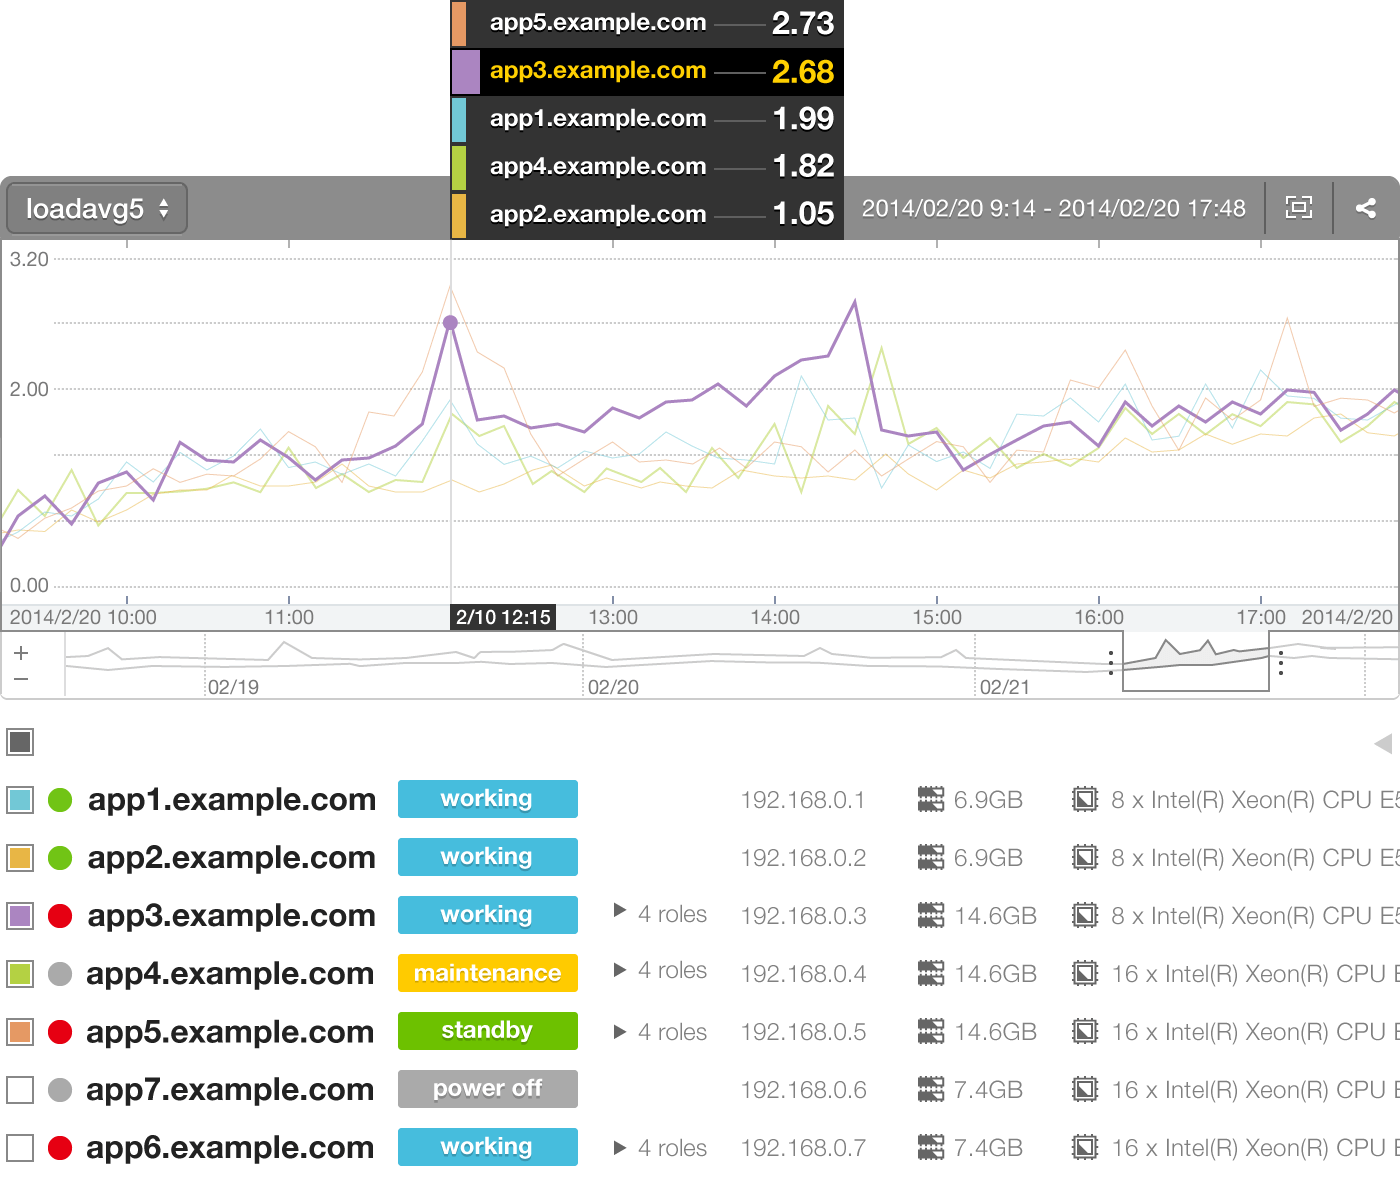
Yoshimuta Being able to look at multiple servers together grouped by role is one of Mackerel's main selling points, but when we first heard that, we actually weren't all that excited about it, but once we started using it every day, we started to understand those metrics. Even with ten servers grouped in one role, we were able to view them all together as our app server. Before that we hadn't considered that kind of perspective.
Hisamori With other tools, you're looking at servers individually rather than in terms of role. That's the on-premise approach, like, there are these boxes which are called servers and we have to watch each box one at a time. From the perspective of someone creating a service, having to watch servers one by one is a real mental block when you're trying to monitor your resources. What's nice about Mackerel is that when you're looking at graphs as a role and, say for example one graph is acting up, all you have to do it jump to that graph's page. That's one major difference.
Yoshimuta They may be distributed in the same way and requests come in the same way, but I'm not really interested in looking at ten servers individually. I just want to understand what's going on as a whole, and in an environment using Mackerel that becomes possible. Develop a feature, go to release, check your tools, and right away you can check it's status.
Hisamori When you're working within the concept of roles, building something new becomes much simpler. Rather than going against it, it's better just to rethink your whole construction. I think constructions that can't be managed with Mackerel will have a lot of difficulties, like not being able to analyze problems or just simplifying in general. Society is progressing so we have all these tools, so why is it that engineers have more and more work to do? We can definitely simplify further and make our lives easier. Ideally we want to focus on the tasks that are most important and spend less time doing unnecessary work. Surely the role of an engineer is to increase productivity and offer something of value.
Hisamori We have been using Mackerel with AWS for six months now, but there's a metrics aggregator function on the cloud service side as well. Some people might be thinking it would be good if we could use this, but I'm not sure if it's a good idea to become dependent on cloud vendor tools. Besides, it's not good for usability. I think it's better for service metrics aggregation and monitoring to be as independent as possible. Using only cloud vendor monitoring tools is not ideal in my opinion. Basically it worsens the ground support of your service.
Tanaka Right now AWS's shares are high, they're at the top, but GCP(Google Cloud Platform) and Microsoft Azure are also moving up. That balance is going to change in the future and we're going to start seeing more multi-cloud users. As a result I think we'll also see more people who want to make sure they're able to switch between platforms. So from that viewpoint there's something to be said for having a monitoring service independent from cloud vendors.
Hisamori By using multiple SaaS's in conjunction, we're moving further away from a single-cloud infrastructure. Our basic setup is for log aggregation we use Google BigQuery, for monitoring we use Hatena's Mackerel, and for information sharing we use Qiita:Team.
Any last comments or thoughts?
Tanaka Mackerel isn't just a server infrastructure status indicator; it can also be used to monitor service KPI. The only obstacle right now is that those notifications get mixed in with the ones regarding server matters. We're working on making it so that, for people who only want to see KPI information unrelated to server infrastructure, notifications can be segregated in that way. I think it would be ideal if each person sees only the notifications they want or need to see.
Moriyama Getting actual hands-on experience with monitoring changes the way you think about it. The things we used to have to request to be done by the infrastructure team can now be done ourselves. If there's a change in traffic we can work out the cause ourselves. We can try customization too, and if something works we go with it.
Yoshimuta I was really surprised by how easy it was incorporating Mackerel. The things you can do by yourself without having to rely on someone else will increase. Also, I'm familiar with and have been using Hatena's many services from before, so the fact that Mackerel is a service from Hatena is peace of mind.
Hisamori Since starting Mackerel I can feel that our cycle of development has picked up speed. Now, if somebody told me to do monitoring by myself without Mackerel, that would be a problem. The state of development and operation is only going to continue changing and progressing, right? So is our current construction permanent? I'd say of course it's not, but I feel like we've created an environment that will easily adapt to change.
mackerel-agent-plugins 0.9.0 released, graphing adjustments made, Mackerel Meetup #4 
We asked our users how they use Mackerel.
Credit cards, leasing, finance, real estate and more
MaaS enterprise for highway buses / railways and mobile portal site operation
Media, Internet Advertising, Game, and Investment Development Business
Providing cloud services well-suited for businesses
Design, development, and operation of online games and digital services
Offering a variety of internet services targeted at consumers
Services promoting collaboration across the globe
Get started with a free trial and experience all the features Mackerel has to offer. To learn more about volume discounts, please contact us using this form.
If you read this whole interview, we'd like to say thanks by offering a 1 week extension on your free trial. Contact sales with the name of the organization you'd like the extension for.