Hello, Mackerel Team Director Kasuya (![]() id:daiksy) here.
id:daiksy) here.
We’ve always made our weekly feature announcements from this blog on Friday, but this week we’re publishing on Thursday.
Last week, participants from the Hatena Summer Internship Program joined the Mackerel development team and started working on feature development. Tomorrow is the last day for our interns and each team will make a presentation to show what they’ve accomplished.
So, this week we’re announcing our new features one day early in preparation for the interns’ presentations tomorrow.
All new features announced this week will be those that the interns have worked on with support from the development team!
Anyways, here is this week’s update information.
Specific metrics can now be specified when posting graphs to notification channels
Up until now, sharing a graph with Mackerel’s graph posting feature meant displaying all metrics included in that graph. For example, even if you only wanted to discuss memory.used trends, you could only share a graph that displayed all the memory metrics
With this update, graphs can now be shared with specific metrics selected in the host metric graph.
The screenshot below shows graphs with only memory.used selected shared in Slack.


And of course, the permalink for this shared graph will also only have memory.used selected.
Notification channels are now displayed in the log of the alert details screen
All channels to which notifications will be sent are now displayed for each log in the alert details screen.

There are three types of icons to verify the notification status; one to show that the notification was successful, one for failed and currently re-sending, and one to show that the notification attempted to re-send the specified number of times, but failed.
Alerts can now be filtered by monitor rule in the alert list
“Monitor rule” has been added as a condition to filter alerts in the alert list.

For example, now it’s easier to do things like display a list of only closed check monitoring alerts and obtain an application’s rate of operation or narrow the list down to external monitoring alerts only and check the Web application status.
When manually closing alerts, the closer and the reason for closing can now be noted
In the notification for when an alert is closed manually, the person who closed the alert and the reason for closing it can now be noted.
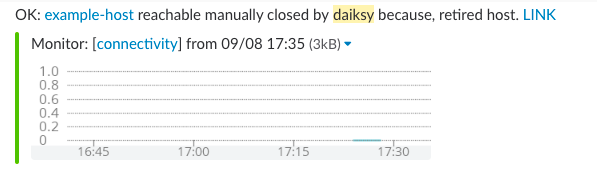
With this, now you can get a better understanding of the manual closing without having to go the the alert details screen.
Upcoming Mackerel events
The Mackerel team is working hard to create opportunities like events and booths where we can meet all our users.
September 21st AWS Cloud Roadshow 2017 Osaka
Mackerel is sponsoring the AWS Cloud Roadshow in Osaka on September 21st. Be sure to stop by if you’re in the area! !
AWS Cloud Roadshow 2017 大阪 powered by Intel® 広島、大阪、名古屋、福岡の 4 都市を巡る無料クラウドカンファレンス開催! | アマゾン ウェブ サービス (Japanese only)
September 26th Drinkup Osaka
Mackerel’s Drinkup event has often been held in Tokyo, but this month it’s being held in Osaka.
I’m looking forward to seeing all of you in the Kansai area!