
Hello, this is Mackerel team CRE's ![]() id:masarasi . I'm pleased to share the details of this update.
id:masarasi . I'm pleased to share the details of this update.
- Updates to APM Tracing
- Changed the specifications of check-disk
- Discontinued Azure Integration support for PostgreSQL Single Server and MySQL Single Server
Updates to APM Tracing
Span Search with Filters
In the "Filter conditions" of the Trace tab, you can now search not only for traces but also for spans. By selecting "Span" in the "Search Mode", you can switch to span search mode. Enter conditions such as span name or attributes and click the "Apply" button to display a list of spans matching the conditions, instead of the trace list. If no filter conditions are set, all spans will be listed.


You can add span attribute values as columns in the span list
In the span list, you can toggle column visibility or add arbitrary attribute values as columns using the "Select Columns" button in the upper right corner of the list. For example, you can explore spans while checking the contents of database queries.


You can now check the posting count of traces and spans
By default, the "Latency Distribution (histogram)" graph is displayed in the Trace tab, but you can now switch to a graph showing the trace posting count by clicking the "Trace Count" button in the upper right corner of the graph. Observing the trend in trace posting counts helps you understand request trends.


Furthermore, when the span list is displayed, a "Span Count" button appears instead of the "Trace Count" button. Clicking this button displays a graph of the span posting count. Observing the trend in span counts helps you understand the execution frequency trends of specific processes, such as database calls. Additionally, since the APM feature is billed based on the span posting count of traces, understanding the span posting count per service also helps in estimating costs.
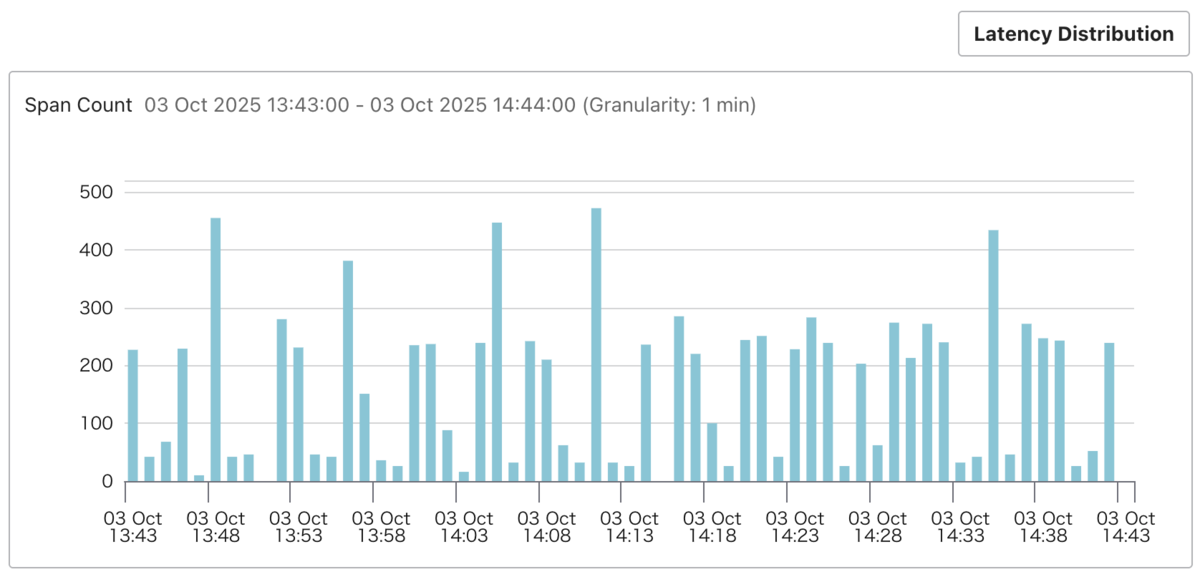
The granularity of the graph changes depending on the displayed period. To check the posting count with 1-minute granularity, set the display period to less than 4 hours.
We plan to have further updates to make the trace and span posting count graphs even more useful in the future, so please look forward to them!
Changed the specifications of check-disk
We have changed the specifications of the check-disk plugin, a check plugin that monitors the capacity of OS partitions.
When check-disk is executed, it obtains information for all OS partitions and then performs monitoring. Previously, if information for any one partition could not be obtained, an Unknown alert would be generated. Now, if --path is specified and the information for the partition specified in --path can be obtained, monitoring will be executed.
Also, when multiple --path are specified, if any of them pointed to a non-existent partition or if there were duplicate partitions, it would previously execute without error. However, please note that due to this change, such cases will now result in an error.
You can use the updated version by installing the following latest releases:
- Linux: mackerel-check-plugins v0.50.0
- Windows: mackerel-agent v0.85.2
Discontinued Azure Integration support for PostgreSQL Single Server and MySQL Single Server
Since Azure Single Server has already been discontinued by Azure, we have removed the integration features for PostgreSQL Single Server and MySQL Single Server from the Azure Integration. On the Azure Integration edit screen, these options can no longer be selected or configured. They are still displayed on the Azure Integration settings list screen, but this will also be removed in the near future.
Please note that after the feature discontinuation, hosts will not be automatically retired. If hosts for Single Server remain without being retired, we kindly ask you to manually retire them as necessary. Thank you for your understanding.