Hello! I'm Sudo from the Mackerel CRE team ( id:do-su-0805). Here are this week's updates.
- AWS ALB integration now supports IPv6 metrics
- APM trace search now supports time ranges shorter than 10 minutes
- Monitors list now shows last alert time and 30-day alert count
- Monitors list is now sortable
- Estimated usage metrics now include log data volume
- terraform-provider-mackerel now supports IP version for URL external monitoring
AWS ALB integration now supports IPv6 metrics
When using the AWS integration to connect Amazon Application Load Balancer (ALB), you can now retrieve the following two IPv6-related metrics:
- Processed Bytes (IPv6)
- Request Count (IPv6)
If you are running ALB in a dual-stack configuration, please take advantage of this new support. mackerel.io
APM trace search now supports time ranges shorter than 10 minutes
Previously, the APM trace search required a minimum time range of 10 minutes — if you specified a shorter range, it would be automatically expanded to 10 minutes. With this improvement, searches now respect the exact time range you specify.
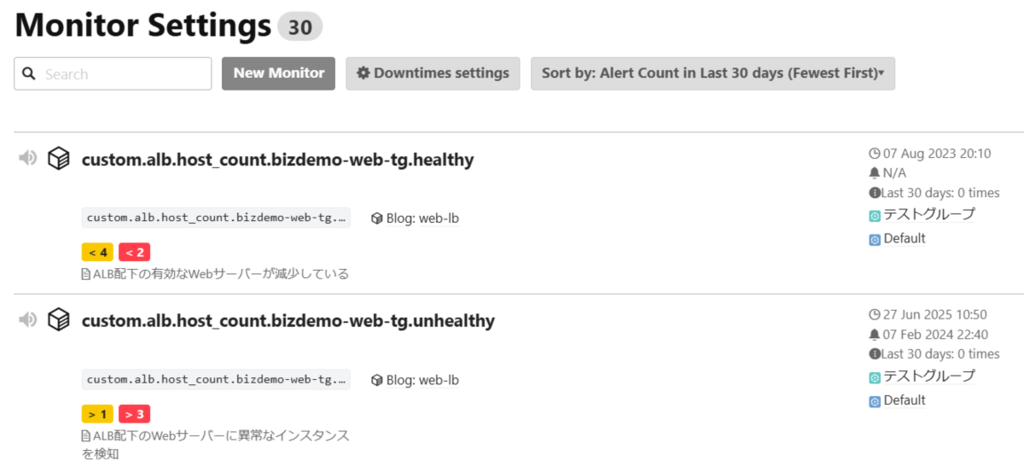
Monitors list now shows last alert time and 30-day alert count
The monitors list page now displays the last time an alert was triggered by each rule, as well as the number of alerts triggered within the past 30 days. This makes it easier to audit unused monitoring rules or identify rules that may not be working as expected.

Monitors list is now sortable
The monitors list page now supports sorting by the following criteria:
- Monitor Type: Sort by monitor rule type (e.g., query monitoring, host metric monitoring)
- Updated At: Sort by the last time a rule was updated
- Last Alert Occurred: Sort by the last time an alert was triggered by the rule
- Alert Count in Last 30 days: Sort by the number of alerts triggered in the past 30 days
Combined with the new last alert time and 30 days alert count columns, this makes it easier to identify unused rules or rules that may have stopped working as intended.
Estimated usage metrics now include log data volume
You can now check log data volume through the estimated usage metrics, which are posted as labeled metrics. Data volume trends are available at per-minute granularity. Use this to monitor your costs and overall usage.
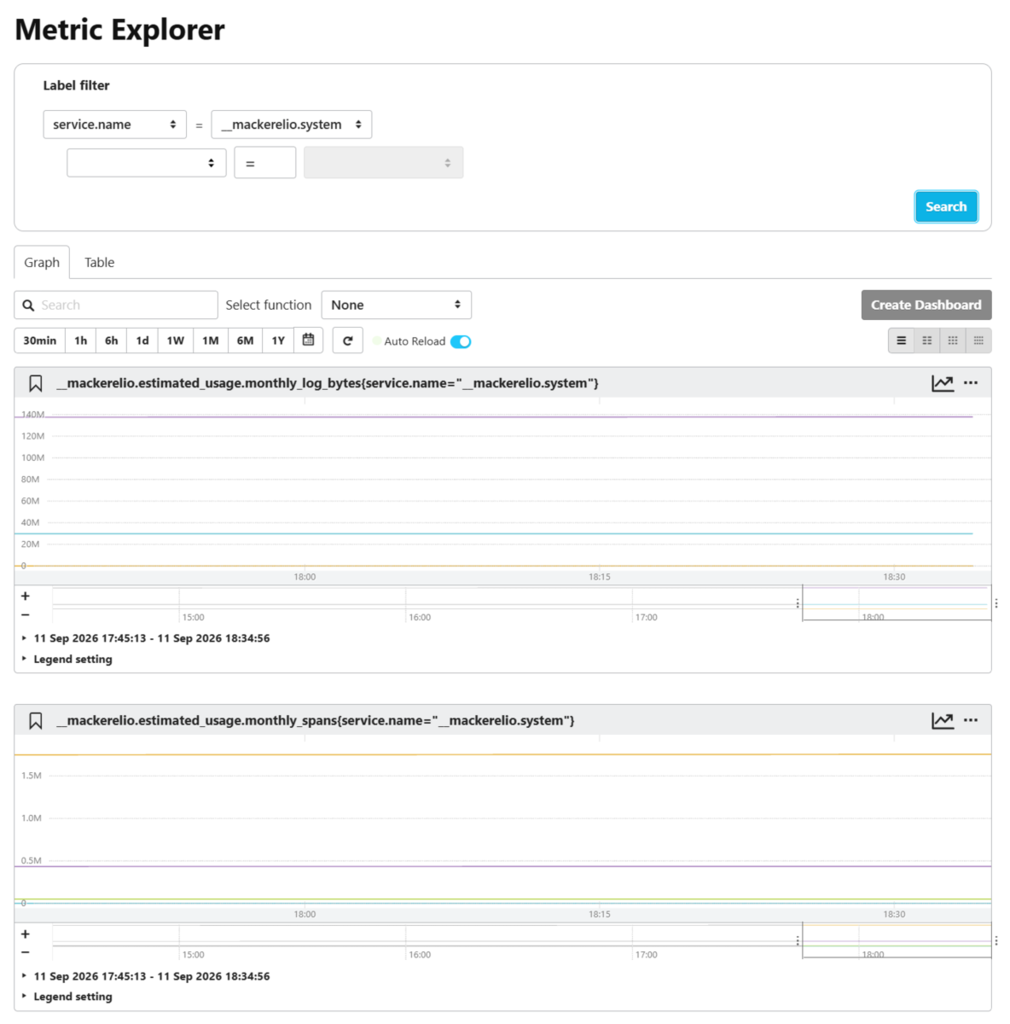
For more details, please refer to the help page. mackerel.io
terraform-provider-mackerel now supports IP version for URL external monitoring
The URL external monitoring configuration in the web console allows you to specify the "IP version" — whether to use IPv4, IPv6, or automatic detection. This setting is now also available in terraform-provider-mackerel.
For configuration details, please refer to the following: registry.terraform.io
